Our system will evaluate the answer based on this AI-generated description.
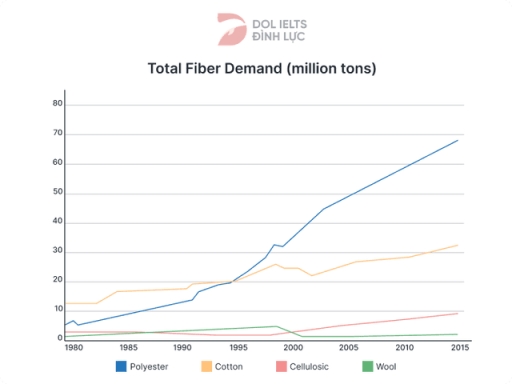
The image depicts a line graph showing total fiber demand in million tons from 1980 to 2015 for four types of fibers: Polyester, Cotton, Cellulosic, and Wool. Polyester starts at just above 10 million tons in 1980, increasing steadily to just below 20 million tons in 1995, followed by a steeper incline to nearly 80 million tons in 2015. Cotton begins at nearly 10 million tons in 1980, rising gradually to approximately 25 million tons in 2015. Cellulosic starts at 5 million tons in 1980, with modest growth to around 6 million tons in 1995, followed by a sharper rise to about 15 million tons in 2015. Wool displays the least growth, starting at roughly 3 million tons in 1980 and ending at around 4 million tons in 2015. The graph includes a horizontal axis marking years at five-year intervals and a vertical axis marking fiber demand from 0 to 80 million tons in increments of 10.
Given the complexity of the image, the above description may not be entirely accurate.
Skyrocket your IELTS band score by 1-2 points in under a month with our premium plan!
Note: Both the topic and the answer were created by one of our users.
The line graph illustrates the global demand for four different types of textile, namely, polyester, cotton, cellulosic and wool between 1980 and 2015.
Overall, it can be clearly seen that demand for polyester reached at the highest level, while the least demand exhibited in the production of wool in the end of the period.
Looking at the details, in 1980, cotton was high demand, with roughly 13%, before experienced steady growth, from about 13% in 1980 to 25% in 2005. Although demand for this product dropped slightly next years, it also represented dramatic rise again, and reached to around 31% in 2005. Polyester was one of the minor demand goods, with about 5% in 1980. However it climbed steadily, and recorded the highest proportion all other textile, with nearly 70% in 2005.
Cellulosic and wool stood at nearly 3% in 1980. The figure for cellulosic rose a bit, with nearly 5%, which was 2 percentage higher than wool in 2000. However proportion of cellulosic demand recorded drop trend, with about 1, while wool upsurged constantly, and was nearly tenfold higher than cellulosic.
Word Count: 182
