Our system will evaluate the answer based on this AI-generated description.
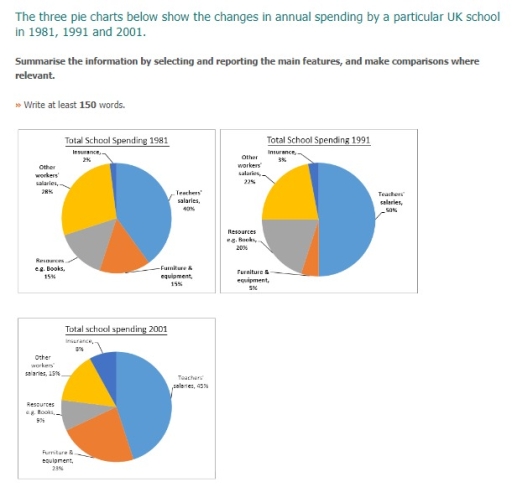
The image contains three pie charts depicting the annual spending breakdown of a UK school in the years 1981, 1991, and 2001. In 1981, the spending is allocated as follows: Teachers' salaries 46%, Furniture & Equipment 15%, Resources (e.g., books) 11%, Insurance 2%, Workers' wages 19%, and Other 7%. By 1991, the distribution changes slightly with Teachers' salaries at 51%, Furniture & Equipment 5%, Resources 10%, Insurance 8%, Workers' wages 22%, and Other 4%. In 2001, there's a notable shift with Teachers' salaries constituting 45% of the budget, Furniture & Equipment 23%, Resources 5%, Insurance 8%, Workers' wages 15%, and Other 4%. This overview illustrates a general trend over the two decades where the proportion of spending on teachers' salaries remains the largest though it slightly decreases by 2001, the allotment for furniture and equipment significantly increases, while the percentage for workers' wages and resources sees a decline.
Given the complexity of the image, the above description may not be entirely accurate.
Skyrocket your IELTS band score by 1-2 points in under a month with our premium plan!
Note: Both the topic and the answer were created by one of our users.
The information about the per-year consumption difference in specific United- Kingdom schools for the period between 1981, 1991, and 2001 is depicted in the provided pie charts.
Looking from an overall perspective, it is readily apparent that school annuals spend the most on teacher’s salaries and the least on insurance.
As is given in the chart, alma maters were most willing to spend their money on tutor’s salaries, spending 40% or over 40%, respectively, On the other hand, the share of insurance was only 2% in 1981; however, it slightly increased between 1991 and 2001, reaching 3% and 8%.
According to the data, spending on other- workers’s fees was the second highest from the years 1981 and 1991; nevertheless, in 2001, it was on furniture and other required equipment significantly, while spending on various resources had 15% in 1981, and after ten years (1991), it was a mere growth of around 20%, but again, it was reduced by 11% in 2001, exceeding 9%.
Word Count: 163
