Our system will evaluate the answer based on this AI-generated description.
The image contains two separate data representations on carbon dioxide emissions. The first part shows two pie charts for 2002 and 2030 with three categories: OECD, Transition economies, and Developing countries. In 2002, OECD has 52%, Transition economies 10%, and Developing countries 38%; in 2030, OECD has 43%, Transition economies 9%, and Developing countries 48%. The second part shows a bar graph titled "Worldwide Carbon Dioxide Emissions by sector" with two bars for each sector representing 2002 and 2030. Sectors include Other sectors, Waste combustion, Transportation, Consumer, and Industry. In 2002, Other sectors have less than 2 billion tons, Waste combustion around 1.5 billion tons, Transportation nearly 6 billion tons, Consumer over 2 billion tons, and Industry approximately 10 billion tons. By 2030, Other sectors increase to just under 4 billion tons, Waste combustion around 2 billion tons, Transportation nearly 10 billion tons, Consumer around 3.5 billion tons, and Industry close to 12 billion tons.
Given the complexity of the image, the above description may not be entirely accurate.
Skyrocket your IELTS band score by 1-2 points in under a month with our premium plan!
Note: Both the topic and the answer were created by one of our users.
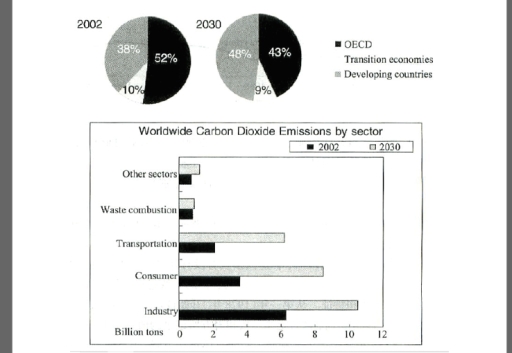
The pie graphs illustrates greenhouse gas emissions and forecast until 2002 to 2030. While the column chart demonstrates around the world carbon dioxide emissions.
Overall ,In 2002 developing countries was around half ,while in 2030 OECD was approximately half. The lower one was transition economies in 2002 and 2030. Whereas in 2002 other sections was the lowest one as waste combustion while the most popular one was industry in 2002. In 2030 was the lowest one waste combustion and the most popular one was industry as in 2002.
In 2002 developing countries was around half of the circle and the OECD was the around more than half respectively 38% and 52%. While in 2030 transition economies has 1% changes compared to 2002 . Developing countries was 48% and the OECD was 43% .
Worldwide carbon emmission by sector in 2002 was the lowest one other sector and waste combustion around 2 billion tones while the popular one was industry at around 6 billion tones.Consumer was 4billion tones and the transportation was about 3 billion tones. In 2030 the most popular one was industry and the lowest one was waste combustion respectively 6 billion tones and 2 billion tones.
Word Count: 198
