🔥 Today Only: Save 30% on Premium — Offer Ends Soon! - Upgrade Now!
Table

Band 5+: The table below gives information about online shopping in one year in the UK. It shows the amounts of money spent on various items by men and women and the percentages for men and women of the total money spent on those items. Summarise the information by selecting and reporting the main features and make comparisons where relevant.

Image for topic: The table below gives information about online shopping in one year in the UK. It shows the amounts of money spent on various items by men and women and the percentages for men and women of the total money spent on those items. Summarise the information by selecting and reporting the main features and make comparisons where relevant.
Our system will evaluate the answer based on this AI-generated description.
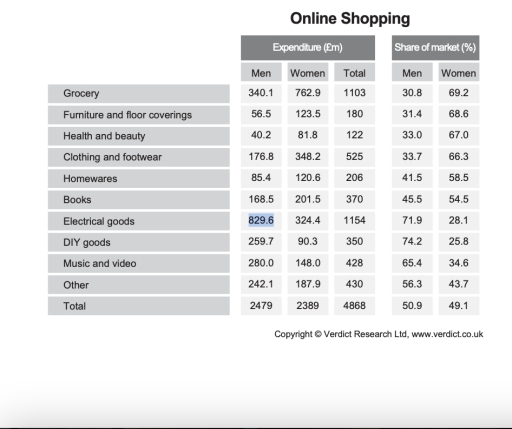
The image shows the online shopping expenditure and share of market segmented by category and gender; Grocery expenditure: Men 340.1, Women 762.9, Total 1103, Share: Men 30.8%, Women 69.2%; Furniture and floor coverings expenditure: Men 56.5, Women 123.5, Total 180, Share: Men 31.4%, Women 68.6%; Health and beauty expenditure: Men 40.2, Women 81.8, Total 122, Share: Men 33%, Women 67%; Clothing and footwear expenditure: Men 176.8, Women 348.2, Total 525, Share: Men 32.7%, Women 67.3%; Homewares expenditure: Men 85.4, Women 120.6, Total 206, Share: Men 41.5%, Women 58.5%; Books expenditure: Men 168.5, Women 201.5, Total 370, Share: Men 45.5%, Women 54.5%; Electrical goods expenditure: Men 829.6, Women 324.4, Total 1154, Share: Men 71.9%, Women 28.1%; DIY goods expenditure: Men 259.7, Women 90.3, Total 350, Share: Men 74.2%, Women 25.8%; Music and video expenditure: Men 280.0, Women 148.0, Total 428, Share: Men 65.4%, Women 34.6%; Other expenditure: Men 240.1, Women 189.9, Total 430, Share: Men 55.8%, Women 44.2%; Total expenditure: Men 2479, Women 2389, Total 4868, Share: Men 50.9%, Women 49.1%.
Given the complexity of the image, the above description may not be entirely accurate.
Note: Both the topic and the answer were created by one of our users.

The table provides data regarding anual online purchase (million pounds) and its share of market (percentage), in the UK by men and women in 10 type of expenditure. According to to the table, one third of total men’s online shopping is for electrical goods which is the largest spending, while women spent the most for grocery shopping. The biggest market share for women is grocery yet electrical DIY goods for men.

The number one women’s expenditure is for grocery (762.9 million pounds), followed by clothing & footwear and electrical goods at 348 and 324.4 million pounds respectively. Women spent the smallest amount of money through online shopping for health & beauty and DIY goods, at 81.8 and 90.3 million pounds. These number do not fully represent their market share. Health & beuty has the third biggest market share (67%) which only 2.2% lower than Grocerry as the biggest female’s market share.

On the other hand, Men used 829.6 million pounds for electrical goods, which count for one third of its total online purcahse. They also alocated over 340 million pounds for grocery and 259.7 million pounds for DIY goods. Surprisingly, the share of market of DIY goods is almost 74%, 2.3% higher than electrical good’s share. These numbers makes grocey and electrical goods as the highest in total expenditure of both women and men, at 1103 and 1154 million pounds respectively.

Word Count: 231

Answers On The Same Topic:

The table below gives information about online shopping in one year in the UK. It shows the amounts of money spent on various items by men and women and the percentages for men and women of the total money spent on those items. Summarise the information by selecting and reporting the main features and make comparisons where relevant.

The table compares the amount of money spent on online shopping by British men and women over one year, as well as their market shares for different items. Overall, the total internet spending of both genders was almost equal, with men spending slightly more than women. Additionally, men spent the most on electrical goods, while […]

The table below gives information about online shopping in one year in the UK. It shows the amounts of money spent on various items by men and women and the percentages for men and women of the total money spent on those items. Summarise the information by selecting and reporting the main features and make comparisons where relevant.

The table chart provides annual statistic regarding online shopping in the United Kingdom. Overall, electrical goods and grocery are the majority type of goods that both men and women shop online. Women spend mostly on the grocery, accounting for 762.9 million pounds and 69.2% share of the market. The second highest expenditure of women is […]

See All

Other Topics:

The table below shows the changes in the number of visitor (in millions) to 5 tourist European attractions from 1981 to 2001. Summarise the information by selecting and reporting the main features, and make comparisons where relevant

The statistics illustrate how many visitors came to five tourist attractions in Europe in 1981, 1991 and 2001, measured in millions. What stands out from the chart is that the amusement park and the National Aquatic Centre witnessed a downward trend in visitor numbers whereas the British Museum and the Rijksmuseum exhibited a contrasting pattern. […]

Task 1: The table below gives information on the percentage of women in the workforce and the proportion of female managers across five countries. Summarise the information by selecting and reporting the main features and making comparisons where relevant.

The provided figure demontrates how different the rate of women employees and women in leader positions are in five different nations. Overall, what stands out from the given image is that the highest rate of women employees is recorded in Japan, while that of managers is in Australia and USA. Moreover, Egyptian female workers recorded […]

The table below shows the percentage of UK residents interested in named sports, carried out three decades.

The table below illustrates the percentages of people interested in six different sports in the UK in 1990, 2000, and 2010. Overall, the football was by far the most popular game among people while the reverse was true for judo. In addition, the percentage of golf and cricket fans changed slightly in same amount over […]

The table shows the two age groups participating in the marathon from 2008 to 2012. Summarize the information by selecting and reporting the main features, and make comparisons where relevant.

The given table illustrates the two age groups participating in the marathon between 2008 and 2012. Overall, it is readily apparent that both age groups showed an upward trend over the entire period. Noticeably, aged groups from 18 to 39 showed the highest figures throughout the entire period. In the year 2008, the age group […]

The table below shows the percentage of UK residents interested in named sports, carried out three decades.

The table compares the results of surveys of people in the UK, carried out in three different decades. Overall, football accounted for the highest percentage in three decades, while the reverse was true for Judo. Also, Golf was the second most popular sport, and rugby came close second to it. Most strikingly, rugby was the […]

See All
We have detected unusual activity on your device.
Please verify your identity to continue.
Note: This verification step won't sign you in. If you have a premium account, please log in to access the service as usual.
Google/Gmail Verification
Or verify using Email/Code
We've sent a verification code to:
youremail@gmail.com (Not your email?)
Enter it below to complete the verification process.
Ensure your email address is correct, your inbox is not full, and you check your spam folder. If no email arrives, consider using an alternative email.
You will need a Premium plan to perform your action!
Note: If you already have a premium account, please log in to access our services as usual.

Plans & Pricing

Our mission is to make quality education accessible for everyone.
However, to keep our hardworking team running and this service alive, we genuinely need your support!
By opting for a premium plan, not only do you sustain us in achieving the mission, but you also unlock advanced features to enrich your learning experience.

Free

For learners who aren't pressed for time

What's included on Free
100+ Cambridge IELTS Tests
Instant IELTS Writing Task 1 & 2 Evaluation (2 times/month)
Instant IELTS Speaking Part 1, 2, & 3 Evaluation (2 times/month)
Instant IELTS Writing Task 1 & 2 Essay Generator (2 times/month)
500+ Dictation & Shadowing Exercises
100+ Pronunciation Exercises
Flashcards
Other Advanced Tools

Premium

For those serious about advancing their English proficiency, and for IELTS candidates aspiring to boost their band score by 1-2 points (especially in writing & speaking) in just 30 days or less

What's included on Premium
Save Your IELTS Test Progress & Analyze Mistakes By Question Type
Save Your Own Flashcard Sets & Use Them On Any Device
Unlock All Courses, IELTS Tests, Section & Part Practice
Unlimited AI Conversations
Unlimited AI Writing Enhancement Exercises
Unlimited IELTS Writing Task 1 & 2 Evaluation
Unlimited IELTS Speaking Part 1, 2, & 3 Evaluation
Checked Answers Will Not Be Published
Unlimited IELTS Writing Task 1 & 2 Essay Generator
Unlimited IELTS Speaking Part 1, 2, & 3 Sample Generator
Unlimited Usage Of Advanced Tools & AI Features
Priority Support within 24h (12-month plan only)

Due to the nature of our service and the provided free trials, payments are non-refundable.