🔥 Today Only: Save 30% on Premium — Offer Ends Soon! - Upgrade Now!
Table

Band 8+: The table below shows the causes of injuries in Australia for teenagers and the general population. Summarize the information by selecting and reporting the main features, making comparisons where relevant.

Image for topic: The table below shows the causes of injuries in Australia for teenagers and the general population. Summarize the information by selecting and reporting the main features, making comparisons where relevant.
Our system will evaluate the answer based on this AI-generated description.
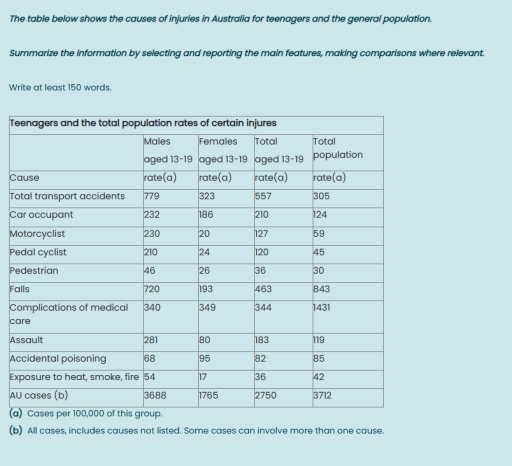
The image presents a table listing injury rates per 100,000 in Australia by cause, divided into males aged 13-19, females aged 13-19, total aged 13-19, and the total population. Total transport accidents: males 779, females 323, total teenagers 557, total population 305. Car occupant: males 232, females 186, total teenagers 210, total population 78. Motorcyclist: males 230, females 24, total teenagers 127, total population 51. Pedal cyclist: males 210, females 26, total teenagers 120, total population 36. Pedestrian: males 46, females 26, total teenagers 36, total population 33. Falls: males 250, females 383, total teenagers 316, total population 1,347. Complications of medical care: males 340, females 349, total teenagers 344, total population 131. Assault: males 281, females 80, total teenagers 183, total population 119. Accidental poisoning: males 68, females 95, total teenagers 82, total population 45. Exposure to heat, smoke, fire: males 34, females 17, total teenagers 26, total population 31. AU cases (all causes): males 3,688, females 1,765, total teenagers 2,750, total population 3,712.
Given the complexity of the image, the above description may not be entirely accurate.
Note: Both the topic and the answer were created by one of our users.

The table compares the rates of various causes of injuries per 100,000 people among Australian teenagers aged 13-19 and the total population. Overall, teenagers – especially males – tend to experience higher injury rates than the general population, particularly from transport accidents and assaults.

Among teenagers, transport accidents were the leading cause of injury, with a total rate of 557 cases per 100,000, much higher than the general population rate of 305. Teenage males were far more affected (779) than females (323). Similarly, **car occupant** and motorcyclist injuries were more prevalent among teenagers, particularly males, with rates of 232 and 230 respectively, compared to 186 and 127 for the total teenage group.

Falls and complications of medical care were the most frequent causes for the general population (721 and 431 respectively), yet both were slightly less common among teenagers (463 and 344). Assaults showed a strong gender disparity among teenagers, with males (281) much more likely to be injured than females (80), whereas the total population rate (119) was lower.

In contrast, accidental poisoning and exposure to heat, smoke, or fire were relatively rare causes of injury in all groups. Overall, the total injury rate was higher for teenagers (2,750) compared with the general population (3,712 per 100,000), though teenage males were disproportionately represented across most categories.

Word Count: 217

Answers On The Same Topic:

The table below shows the causes of injuries in Australia for teenagers and the general population. Summarize the information by selecting and reporting the main features, making comparisons where relevant.

The table demonstrates teenagers’ and the total population’s injury causes in Australia. In general, males had the highest number of injuries in both total transport accidents and in other different types of medical injuries, which leads to the highest number in all cases, among all other groups excluding total population number. to begin with males […]

The table below shows the causes of injuries in Australia for teenagers and the general population. Summarize the information by selecting and reporting the main features, making comparisons where relevant.

The table shows the rate of injured kinds following the gender at age of 13-19 and the total population. Almost accidents involving transportation type. In addition, injured population is commonly noticeable in male group. In transport accidents, the injuries in different types of transport in males aged 13-19 years old is higher that that of […]

The table below shows the causes of injuries in Australia for teenagers and the general population. Summarize the information by selecting and reporting the main features, making comparisons where relevant.

The table illustrates the incidence of various injuries in Australia, comparing male and female teenagers (aged 13-19) with the general population, measured in rates per 100,000 people. Overall, it is clear that teenage males experience significantly higher rates of injury than their female counterparts across almost all categories, particularly in transport-related accidents. Additionally, while the […]

The table below shows the causes of injuries in Australia for teenagers and the general population. Summarize the information by selecting and reporting the main features, making comparisons where relevant.

The table illustrates the incidence of various injuries in Australia, comparing male and female teenagers (aged 13-19) with the general population, measured in rates per 100,000 people. Overall, it is clear that teenage males experience significantly higher rates of injury than their female counterparts across almost all categories, particularly in transport-related accidents. Additionally, while the […]

The table below shows the causes of injuries in Australia for teenagers and the general population. Summarize the information by selecting and reporting the main features, making comparisons where relevant.

This table presents statistics on various injuries among 100,000 teenagers in Australia, categorized by gender. The types of injuries included are total transport accidents, car occupant incidents, motorcyclist injuries, pedal cyclist incidents, pedestrian injuries, falls, complications from medical care, assault, accidental poisoning, exposure to heat, smoke or fire, and other causes not specifically listed above. […]

See All

Other Topics:

The table gives information about the number of people working as researchers in technology per million people in five countries. Summarise the information by selecting and reporting the main features and make comparisons where relevant.

The table provides data about technology researchers per million people in five countries between 2003 and 2007. Overall, Turkey faced a sharp rise in the number of technology researchers over the period, while Poland saw a steady decline. In contrast, Mexico experienced a fluctuating increase in the number of researchers . However , in Moldova […]

The table below shows the results of a 20-year study into why adults in the UK attend arts events. Summarise the information by selecting and reporting the main features, and make comparisons where relevant.

The table compares the percentages of adults in the UK who attended arts events for various reasons over a 20-year period. It is clear that the desire to see a specific performer was the highest reason for attending arts events, while going for the work was the lowest. In terms of the reasons for attending […]

Percentage of people using different types of transport to get to work (2000, 2010, 2020)

The table illustrates proportion of individuals travelling to their workplace by various types of vehicles. Overall, it is clear that with the sole exception of cars, all other modes of transport registered a significant drop over the period. Also cars recorded higher values across all years, and bycycle was lagging at the end of the […]

The graph below shows the oil production ( in barrels) in several African countries from 2000 to 2004.

The table demonstrates the amount of oil produced in four African countries. Overall, it is clear that Congo was the largest oil producer at the beginning of the period, although its production declined slightly. In contrast, Somalia and Chad experienced significant increases, while Nigeria’s production slightly fluctuated. Nigeria and Congo started the period by producing […]

the following table gives statistics showing the aspects of quality of life in five countries. Summarize the information by selecting and reporting the main features and make comparisons where relevant.

The following table provides statistics showing the aspects of quality of life in countries named Bangladesh, Bolivia, Egypt, Indonesia and the USA. Looking from an overall perspective. Overall, it can be seen that The United States had a higher GNP per head than the other countries , whereas Bangladesh had the lowest calorie supply per […]

The graph below shows the daily water consumption for Americans in their homes. Summarise the information by selecting and reporting the main features, and make comparisons where relevant.

The table compares the average amount of water used daily by households in the USA across various categories in 2011 and 2012, following the application of water efficiency measures. Overall, total daily usage of water decreased significantly after the water-saving measures were introduced. While the majority of categores experienced a reduction, some showed minimal change […]

See All
We have detected unusual activity on your device.
Please verify your identity to continue.
Note: This verification step won't sign you in. If you have a premium account, please log in to access the service as usual.
Google/Gmail Verification
Or verify using Email/Code
We've sent a verification code to:
youremail@gmail.com (Not your email?)
Enter it below to complete the verification process.
Ensure your email address is correct, your inbox is not full, and you check your spam folder. If no email arrives, consider using an alternative email.
You will need a Premium plan to perform your action!
Note: If you already have a premium account, please log in to access our services as usual.

Plans & Pricing

Our mission is to make quality education accessible for everyone.
However, to keep our hardworking team running and this service alive, we genuinely need your support!
By opting for a premium plan, not only do you sustain us in achieving the mission, but you also unlock advanced features to enrich your learning experience.

Free

For learners who aren't pressed for time

What's included on Free
100+ Cambridge IELTS Tests
Instant IELTS Writing Task 1 & 2 Evaluation (2 times/month)
Instant IELTS Speaking Part 1, 2, & 3 Evaluation (2 times/month)
Instant IELTS Writing Task 1 & 2 Essay Generator (2 times/month)
500+ Dictation & Shadowing Exercises
100+ Pronunciation Exercises
Flashcards
Other Advanced Tools

Premium

For those serious about advancing their English proficiency, and for IELTS candidates aspiring to boost their band score by 1-2 points (especially in writing & speaking) in just 30 days or less

What's included on Premium
Save Your IELTS Test Progress & Analyze Mistakes By Question Type
Save Your Own Flashcard Sets & Use Them On Any Device
Unlock All Courses, IELTS Tests, Section & Part Practice
Unlimited AI Conversations
Unlimited AI Writing Enhancement Exercises
Unlimited IELTS Writing Task 1 & 2 Evaluation
Unlimited IELTS Speaking Part 1, 2, & 3 Evaluation
Checked Answers Will Not Be Published
Unlimited IELTS Writing Task 1 & 2 Essay Generator
Unlimited IELTS Speaking Part 1, 2, & 3 Sample Generator
Unlimited Usage Of Advanced Tools & AI Features
Priority Support within 24h (12-month plan only)

Due to the nature of our service and the provided free trials, payments are non-refundable.