🔥 Today Only: Save 30% on Premium — Offer Ends Soon! - Upgrade Now!
Table

Band 5+: The table below shows the results of a survey that asked 6800 scottish adults whether they had taken part in different cultural activties

Image for topic: The table below shows the results of a survey that asked 6800 scottish adults whether they had taken part in different cultural activties
Our system will evaluate the answer based on this AI-generated description.
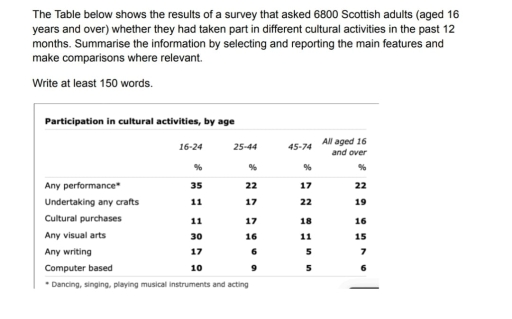
The image presents a table detailing the participation in cultural activities by age among 6800 Scottish adults aged 16 and over. For ages 16-24, "Any performance*" participation is 35%, "Undertaking any crafts" is 11%, "Cultural purchases" is 11%, "Any visual arts" is 30%, "Any writing" is 17%, and "Computer based" is 10%. Ages 25-44 show "Any performance*" at 22%, "Undertaking any crafts" at 17%, "Cultural purchases" at 17%, "Any visual arts" at 16%, "Any writing" at 10%, and "Computer based" at 9%. For the 45-74 age group, "Any performance*" is 17%, "Undertaking any crafts" rises to 22%, "Cultural purchases" is 18%, "Any visual arts" is 11%, "Any writing" is 6%, and "Computer based" is 5%. Overall, for all aged 16 and over, the participation rates are: "Any performance*" 22%, "Undertaking any crafts" 19%, "Cultural purchases" 18%, "Any visual arts" 15%, "Any writing" 7%, and "Computer based" 6%. *Activities include dancing, singing, playing musical instruments, and acting.
Given the complexity of the image, the above description may not be entirely accurate.
Note: Both the topic and the answer were created by one of our users.

The table chart given illustrates the outcome of an investigation about the rate of the participation of scottish adults (aged 16 years and over) to various cultural activities in that year.

Overall; the biggest participation is by far in the performance based activities(dancing,singing,acting…) with a downright trend based on the ages.In the other hand the second least popular activies are computer based ones with an decrease of participations by age.

While performance based exercices had the biggest attendance are the most popular activities in between the ages of 16 and 24 at 35%, between the participants over the age of 45 it fluctuated to 17% and to the 3th most popular activitiy.Likewise the computer based activities also had a downright trend by ages but also it had the lowes overall participation.On the contrary at the cultural purchases side there is an upright graphic depending on age.Between the artistic activities visual arts were popular by a big margin.

Word Count: 157

Answers On The Same Topic:

The table below shows the results of a survey that asked 6800 scottish adults whether they had taken part in different cultural activties

The table illustrates the results of a survey that asked 6800 scottish adults (aged 16 years and above) whether they had taken part in six different cultural activities (Any performance, Undertaking any crafts, Cultural purchases, Any visual arts, Any writing, and Computer based). Overall, it can be seen that the youngest and oldest groups had […]

The table below shows the results of a survey that asked 6800 scottish adults whether they had taken part in different cultural activties

The table demonstrates what percentage of Scottish inhabitants participated in six different activities throughout the last year. In general, any performances, undertaking crafts and visual arts were more frequent answers among all the age groups. In contrast, cultural purposes, writing and computer based activities seemed to be less attractive to the participants. People at the […]

The table below shows the results of a survey that asked 6800 scottish adults whether they had taken part in different cultural activties

The table gives information about the percentage of Scottish adults in different age groups who joined in several cultural activities during the last 12 months. Overall, people aged 16 to 24 took part in cultural activities more than the other groups, while older people had lower participation. Doing performance was the most popular activity among […]

The table below shows the results of a survey that asked 6800 scottish adults whether they had taken part in different cultural activties

The table exhibits the comparison of activities (any performance, undertaking crafts, cultural purchases, visual arts, writing and computing) which are participated by several groups of people: 16-24, 25-44, 45-74 as well as all individuals who aged 16 and over. The information was provided in percentages (%). Overall, the highest figure in any performance section is […]

See All

Other Topics:

The table presents how much people from five employment sectors earned, in three different salary levels in 2009. Summarise the information by selecting and reporting the main features, and make comparisons where relevant.

The table illustrates the maximum, minimum and average earnings across five employment sectors in 2009. Overall, finance was the highest-paying sector at every level, while hospitality and construction paid the least. Another notable feature is that finance had the biggest gap between its top and bottom earners. Finance workers earned the most, with maximum, minimum […]

The table below shows the percentage of employers in various sectors having difficulty in finding staff in 2003 to 2004.

The table illustrates the percentage of employers in various sectors having difficulty in finding staff in 2003 and 2004. Overall, an upward trend can be observed in the figures for skilled and unskilled workers, while the opposite trend was seen in the percentage of employers having difficulty finding technical and managerial staff. While manufacturing became […]

The table shows the two age groups participating in the marathon from 2008 to 2012. Summarize the information by selecting and reporting the main features, and make comparisons where relevant.

The table illustrates the two age groups involving in the marathon between 2008 and 2012. Overall, it is evident that the total number of participants and the participation increased steadily in both age groups and rose constantly throughout the years. However, individuals aged 18 to 39 tended to take part in marathon greater than the […]

the table shows the proportions of pupils attending four secondary school types between between 2000 and 2009. Summaries the information by selecting and reporting the main features and make comparisons where relevant. write at least 150 words

The given table illustrates the percentage of four types of secondary school students from 2000 to 2009. Overall there was a decrease in the portion of students of schools of specialist , grammar, and voluntary controlled durion the period. On contrast , community schools had the highest figure. Getting back to the details, in 2000 […]

The table below shows the number of gold, silver, and bronze medals won by the top 10 countries in 2004 Olympics, along with their total medal counts. Summarise the information by selecting and reporting the main features, and make comparisons where relevant.

The table displays the overall medal standings of the top performing countries in the 2004 Olympics held in Athens, Greece, categorizing awards in gold, silver, and bronze, alongside total medal counts. Overall, United States, the only North American country in the list, dominated the prestigious sporting event, leading both in the number of gold medals […]

Describe the information shown below in your own words. What implications do the indicators have for the countries.

the table show social and economic for four countries namely canada, jepang, peru and zaire in 1994. the information includes annual income per person, life expectancy at birth, daily calorie supply, and adult literacy rate. overall, canada and japan had much higher figures for most indicators than peru and zaire. japan had the highest annual […]

See All
We have detected unusual activity on your device.
Please verify your identity to continue.
Note: This verification step won't sign you in. If you have a premium account, please log in to access the service as usual.
Google/Gmail Verification
Or verify using Email/Code
We've sent a verification code to:
youremail@gmail.com (Not your email?)
Enter it below to complete the verification process.
Ensure your email address is correct, your inbox is not full, and you check your spam folder. If no email arrives, consider using an alternative email.
You will need a Premium plan to perform your action!
Note: If you already have a premium account, please log in to access our services as usual.

Plans & Pricing

Our mission is to make quality education accessible for everyone.
However, to keep our hardworking team running and this service alive, we genuinely need your support!
By opting for a premium plan, not only do you sustain us in achieving the mission, but you also unlock advanced features to enrich your learning experience.

Free

For learners who aren't pressed for time

What's included on Free
100+ Cambridge IELTS Tests
Instant IELTS Writing Task 1 & 2 Evaluation (2 times/month)
Instant IELTS Speaking Part 1, 2, & 3 Evaluation (2 times/month)
Instant IELTS Writing Task 1 & 2 Essay Generator (2 times/month)
500+ Dictation & Shadowing Exercises
100+ Pronunciation Exercises
Flashcards
Other Advanced Tools

Premium

For those serious about advancing their English proficiency, and for IELTS candidates aspiring to boost their band score by 1-2 points (especially in writing & speaking) in just 30 days or less

What's included on Premium
Save Your IELTS Test Progress & Analyze Mistakes By Question Type
Save Your Own Flashcard Sets & Use Them On Any Device
Unlock All Courses, IELTS Tests, Section & Part Practice
Unlimited AI Conversations
Unlimited AI Writing Enhancement Exercises
Unlimited IELTS Writing Task 1 & 2 Evaluation
Unlimited IELTS Speaking Part 1, 2, & 3 Evaluation
Checked Answers Will Not Be Published
Unlimited IELTS Writing Task 1 & 2 Essay Generator
Unlimited IELTS Speaking Part 1, 2, & 3 Sample Generator
Unlimited Usage Of Advanced Tools & AI Features
Priority Support within 24h (12-month plan only)

Due to the nature of our service and the provided free trials, payments are non-refundable.