Our system will evaluate the answer based on this AI-generated description.
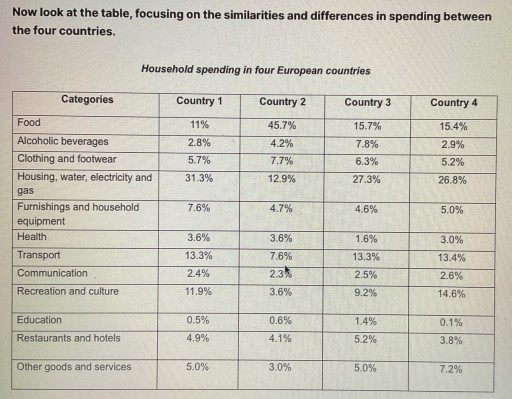
The image shows a table comparing household spending percentages in four European countries across various categories, such as food, alcoholic beverages, clothing and footwear, housing, water, electricity and gas, furnishings and household equipment, health, transport, communication, recreation and culture, education, restaurants and hotels, and other goods and services. Country 1 spends the most on food (11%), while Country 2 spends the least (4.5%). Country 3 has the highest percentage for alcoholic beverages (7.8%) and clothing and footwear (12.7%). Housing, water, electricity and gas spending is highest in Country 4 (26.8%). Country 2 spends the least on furnishings and household equipment (4.7%) and health (3.6%). Transportation spending is highest in Country 3 (13.3%). Communication spending is consistent across all four countries, ranging from 2.3% to 3.4%. Recreation and culture spending is highest in Country 4 (14.6%) and lowest in Country 2 (3.6%). Education spending ranges from 0.4% in Country 2 to 1.4% in Country 3. Country 3 also has the highest spending on restaurants and hotels (5.8%), while Country 4 has the lowest (0.1%). Other goods and services spending is highest in Country 4 (7.2%) and lowest in Country 2 (3.0%).
Given the complexity of the image, the above description may not be entirely accurate.
Skyrocket your IELTS band score by 1-2 points in under a month with our premium plan!
Note: Both the topic and the answer were created by one of our users.
The graph illustrates the percentage of all household expenditures on various common goods and valuable services among four European nations. Overall, education receives the least amount of spending among the four countries and while country 2 significantly prioritize goods all related to food compared to other European countries.
In consumer goods, the 3 countries agreed that all expenses related to housing, water, electricity, and gas is the most vital with Country 1,3, and 4 allocating 31.3%, 17.3%, and 26.8%, respectively, compared to country 2 allocation of 12.9%. Country 2’s goods related to food is the highest spending with 45.7% with other countries spending only below 16%.
While in services, education is consistent among four European nations receiving only under 1.5%. The same situation is with communication services, as its percentages range from 2.4% to 2.6%. 3 countries agreed that transportation is the most valuable service receiving an average proportion of 13.4%.
Word Count: 151
