Our system will evaluate the answer based on this AI-generated description.
The image contains two pie charts depicting domestic water usage in the years 1988 and 2008. In the 1988 chart, percentages allocated to categories are as follows: bathroom (22%), washing clothes (15%), toilets (25%), garden (20%), and kitchen (18%). In the 2008 chart, the percentages for each category are displayed as: bathroom (28%), washing clothes (14%), toilets (29%), garden (7%), and kitchen (22%). The 2008 chart showcases a significant increase in water usage for bathrooms and toilets compared to the 1988 chart, with a 6% and 4% rise respectively. Conversely, the usage for washing clothes and garden are noticeably decreased by 1% and 13% respectively in the 2008 chart. Kitchen usage stays relatively similar across both years, only showing a slight increase of 4% in the 2008 chart. The charts are titled "Domestic water usage" and labeled with the specific years they represent.
Given the complexity of the image, the above description may not be entirely accurate.
Skyrocket your IELTS band score by 1-2 points in under a month with our premium plan!
Note: Both the topic and the answer were created by one of our users.
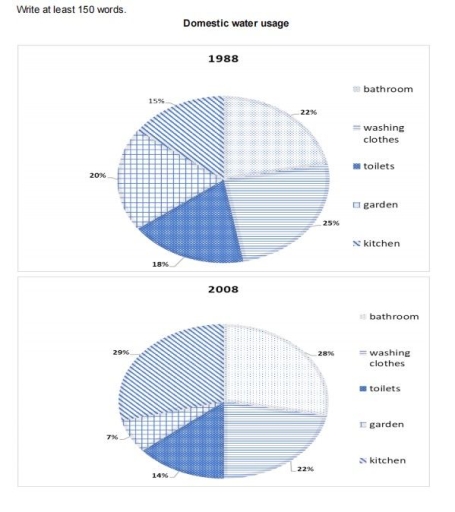
The pie charts illustrate the percentage distribution of water consumption among five categories(bathroom, washing clothes, toilets, garden and kitchen) between 1988 and 2008.
Overall, bathroom and kitchen water usage increased to over half of the proportion at the expense of other categories, which in turn decreased over the given period. Furthermore, garden water consumption declined threefold and comprised of the lowest percentage in 2008.
In terms of the first year, washing clothes constituted the largest proportion, representing exactly a quarter of the total, followed by bathroom at 22%. Together, these categories accounted for approximately half of the proportion, considerably outweighing the contribution of the remaining sectors.
By 2008, the proportion attributed to washing clothes and toilets had fallen insignificantly, reaching 22% and 14% respectively. Conversely, kitchen water usage went up rapidly, doubling its proportion from 15% to 29%, whereas garden, on the other hand, dropped dramatically by 13 percent over the given years.
Word Count: 153
