Our system will evaluate the answer based on this AI-generated description.
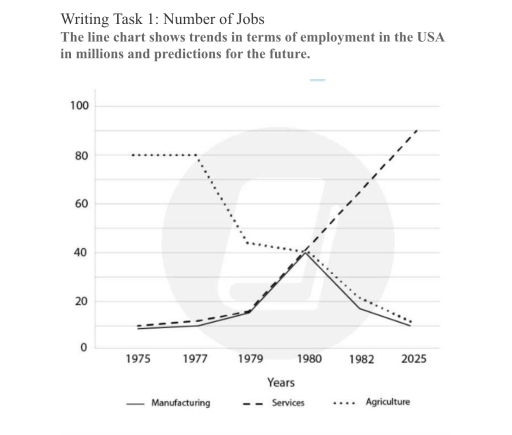
The image presents a line chart delineating employment data in millions for the USA across three sectors—manufacturing, services, and agriculture—over the years 1975, 1977, 1979, 1980, 1982, and projecting onto 2025; manufacturing commenced below 20 million in 1975, remained steady through 1979, peaked briefly at approximately 40 million around 1980, then sharply decreased to slightly above 20 million by 1982, forecasted to stabilize at the same level by 2025; services initiated slightly above 40 million in 1975, sustained minimal growth to near 50 million by 1980, observed a modest dip to below 50 million in 1982, and projected to ascend rapidly reaching 100 million by 2025; agriculture started slightly under 10 million in 1975, exhibited slight growth through 1979, dropped marginally below 10 million by 1980, continued a declining trajectory falling under 5 million by 2025.
Given the complexity of the image, the above description may not be entirely accurate.
Skyrocket your IELTS band score by 1-2 points in under a month with our premium plan!
Note: Both the topic and the answer were created by one of our users.
The line graph illustrates employment figures in the USA, measured in millions, from 1975 to 2025, including predictions for the future.
Overall, the number of jobs in the services sector increased significantly over the period, while employment in agriculture decreased considerably. Manufacturing employment rose sharply until 1980 before falling towards 2025.
Regarding the most noticeable changes, the number of jobs in the services sector started at 15 million in 1975 and then increased to around 40 million in 1979, before rising further to approximately 90 million in 2025. In addition, employment in the agriculture sector decreased considerably, started at 80 million in 1977 to falling from around 42 million in 1979. It then declined further to approximately 20 million in 1982 and 10 million in 2025.
On the other hand, the number of jobs in the manufacturing sector fluctuated over the period. It stood at around 8 million in 1975 and increased slightly to approximately 15 million in 1979. This figure then rose sharply to 40 million in 1980, before falling to around 17 million in 1982 and approximately 10 million in 2025.
Word Count: 183
