Our system will evaluate the answer based on this AI-generated description.
The image displays a line graph titled "Average annual expenditure on cell phone, national and international fixed-line services, 2001-2010." Three lines represent different services: cell phone services (dashed line), international fixed-line services (solid line), and national fixed-line services (dotted line). The x-axis represents years from 2001 to 2010, and the y-axis shows expenditure in dollars, ranging from $100 to $800. The cell phone services line shows an upward trend starting at approximately $200 in 2001 and reaching $700 in 2010. The international fixed-line services line shows a downward trend starting at approximately $700 in 2001 and falling to $400 in 2010. The national fixed-line services line remains relatively stable, starting at around $300 in 2001, increasing slightly to $400 in the middle years, and ending around $300 in 2010.
Given the complexity of the image, the above description may not be entirely accurate.
Skyrocket your IELTS band score by 1-2 points in under a month with our premium plan!
Note: Both the topic and the answer were created by one of our users.
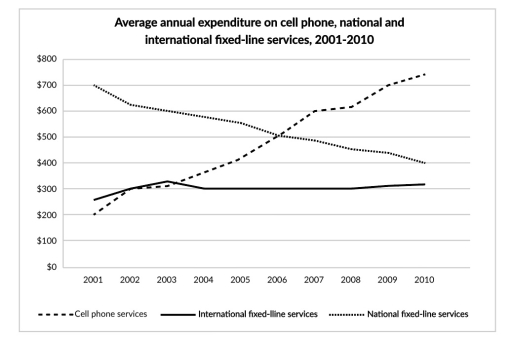
The graph below illustrate consumer’s average yearly spending on three phone services, Cell phone services, international fixed-line services and National fixed line services from 2001 to 2010.
Overall, the three types of services differ with different trends. cell phone services were the only one seen towards a higher level compare to other two services.
According to 2001, people spent $700 times on the national fixed line services. During the same period, people spent $200 times on cell phone and nearly $250 on the international Services. In 2002, cell phone services seen as rapidly increasing while national fixed line services seen as falling down. cell phone services go up to almost $800 in the year 2010.
On other hands time spent on National-fixed line services sinking from $ 700 +0 just about $400.
In 2002, we can observe that time spent on international fixed-line services is steadily increasing up to nearly $303 and again moving down to almost $300 and remain equal from 2004 to 2008. and slowly grow up to nearly $301 from 2009 and in 2010 it grow upto $ 302 time spent on international-fixed-line services .
Word Count: 188