24 Hours Only: Get 39% OFF on Our Premium Plan - Check Out Now!
Multiple Graphs

Band 6+: The chart below shows what Anthropology graduates from one university did after finishing their undergraduate degree course. The table shows the salaries of the anthropologists in work after 5 years.Summarize the information by selecting and reporting the main features, and make comparisons where relevant.

Image for topic: The chart below shows what Anthropology graduates from one university did after finishing their undergraduate degree course. The table shows the salaries of the anthropologists in work after 5 years.Summarize the information by selecting and reporting the main features, and make comparisons where relevant.
Our system will evaluate the answer based on this AI-generated description.
The image displays a pie chart and a table, with the chart detailing the post-graduation status of Anthropology graduates: full-time work at 52%, part-time work at 15%, postgrad study combined with part-time work at 5%, unemployed at 12%, and unspecified activities at 8%. The accompanying table shows the salary distribution of anthropologists after five years of work across three employment sectors. For private companies, salaries are under $25,000 at 5%, $25,000 to $49,999 at 10%, $50,000 to $74,999 at 15%, $75,000 to $99,999 at 25%, and $100,000+ at 45%. Freelance consultants earn under $25,000 at 0%, $25,000 to $49,999 at 5%, $50,000 to $74,999 at 15%, $75,000 to $99,999 at 40%, and $100,000+ at 40%. Government sector salaries show under $25,000 at 0%, $25,000 to $49,999 at 5%, $50,000 to $74,999 at 10%, $75,000 to $99,999 at 35%, and $100,000+ at 50%.
Given the complexity of the image, the above description may not be entirely accurate.
Note: Both the topic and the answer were created by one of our users.

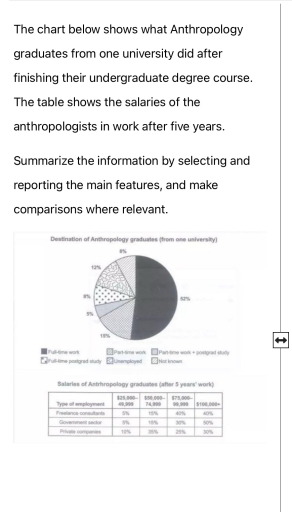
The pie chart provides data about the activities of students in one university after graduating with Anthropology degree. The table gives information about amount of salaries based on the types employment they earned after 5 years of working experience.

Overall, significant number of students work full-time job after finishing Anthropology degree. The government sector offered the highest salaries after five years of employment.

It is clear that over half of the Anthropology graduates worked full-time job. Second lead destination of Anthropology graduates was part-time work, marked at quarter of all students. smaller number (5%) did both part-time work and study. Meanwhile, 12% of graduates were unemployed, and the destination of 8% was not known.

The table shows that majority of workers in government sector earn more than 100 thousand dollars, marked at 50 percent. Freelance consultants also had a high income, with 40 percent earning more than 100 thousand dollars. In contrast, only 30 percent of private company workers reached this level.

Word Count: 162

Answers On The Same Topic:

The chart below shows what Anthropology graduates from one university did after finishing their undergraduate degree course. The table shows the salaries of the anthropologists in work after 5 years.Summarize the information by selecting and reporting the main features, and make comparisons where relevant.

The pie chart illustrates the what Anthropology graduates from one university did after finishing their undergraduate degree course. The table demonstrates the salaries of the anthropologists in work after 5 years. Overall, there were more graduates for full-time work, and less graduates for part-time work postgrad study. Full-time workers was 52%. Salaries for them was […]

The chart below shows what Anthropology graduates from one university did after finishing their undergraduate degree course. The table shows the salaries of the anthropologists in work after 5 years.Summarize the information by selecting and reporting the main features, and make comparisons where relevant.

The chart demonstrates what Anthropology graduates from one university did after finishing their tertiary education course. Moreover, the table illustrates the wage of the anthropologists in work after 5 years. There are 6 types of works done by anthropologists and each of them includes the percentage of anthropologists who chose this work. Generally, if anthropologists […]

The chart below shows what Anthropology graduates from one university did after finishing their undergraduate degree course. The table shows the salaries of the anthropologists in work after 5 years.Summarize the information by selecting and reporting the main features, and make comparisons where relevant.

The pie chart demonstrates what Anthropology graduates from one university did after finishing their undergraduate degree course. The table chart illustrates the income of the Anthropology graduates in occupation after 5 years. Overall, it is clear that the full-time work most well-known, espesially among student, whereas part-time jobs had a significantly growth. Unwaged graduates were […]

The chart below shows what Anthropology graduates from one university did after finishing their undergraduate degree course. The table shows the salaries of the anthropologists in work after 5 years.Summarize the information by selecting and reporting the main features, and make comparisons where relevant.

The chart delineates the carrier path of anthropology graduates after finishing undergraduate degree courses . The table depicts the salaries of anthropologists in work after 5 years. Overall, it is notable that majority of the undergraduate students worked full time compared minority of them, who worked part- time and studied postgraduate degree. Most of the […]

See All

Other Topics:

The pie charts give information about average percentages of sodium saturated fats and added typical meals consumed in the USA Summarise the information by selecting the main features, and make comparisons where relevant

Overall, USA Citizens Consumed less amount of Sodium, Saturated fat and added Sugar in breakfast time. In dinner have The large amount Consumed at Sodium 43%, nearby half of all meals. Lunch had small difference from dinner 29%. and breakfast and Snacks are had. Same % amount of Sodium 14%. The Saturated fat is higher […]

The pie charts give information about average percentages of sodium saturated fats and added typical meals consumed in the USA Summarise the information by selecting the main features, and make comparisons where relevant

The Pie charts display three different substance in everyday meals across USA. Over all in USA they consume a high amount of Sodium in dinner. Similarly saturated fat also highly consume in dinner whereas the concentration of added sugar is most in snacks. To begin with, Sodium is mostly consumed at night te%, dinner (63%). […]

The chart below show the main reasons for study among students of different employers. summarise the information by selecting and reporting the main features and make comparisons where relavent

The data presents the students’ reasons to study, that divided in age categories and a number of the help what they receiving from employers. Overall, it is clear that younger generations getting more employer support than older learners. However, youth’s motivation for study is the succsessful career, in contrast of people that more older, who […]

The pie chart shows the main causes of worldwide land degradation. The table shows how these causes affected three regions of the world during the 1990s. Summarise the information by selecting and reporting the main features, and make comparisons where relevant.

The pie chart illustrates the reasons why agricultural land is becoming less fertile, and the table demonstrates the effect of this in three particular regions of the world in the 1990s. Overall, there are four reasons for less productive land, which are over-grazing, over-cultivation, deforestation, and other. Additionally, the most degraded land is Europe, and […]

The line graph and pie charts below show the percentage of the population aged between 18 and 34 years old in a country from 1978 to 2011 and the percentage of this age group of people living in different regions in 1978 and 2011. Summarise the information by selecting and reporting the main features, and make comparisons where relevant. Write at least 150 words.

Two types of chart shown below represent the number of people aged 18-34 between 1978 and 2011 in cities, towns and rural areas. Overall, the percentage of population aged 18-34 in cities is the highest point in the pie charts. However, the number of population in rural areas had the most decrease between 1978 and […]

See All
We have detected unusual activity on your device.
Please verify your identity to continue.
Note: This verification step won't sign you in. If you have a premium account, please log in to access the service as usual.
Google/Gmail Verification
Or verify using Email/Code
We've sent a verification code to:
youremail@gmail.com (Not your email?)
Enter it below to complete the verification process.
Ensure your email address is correct, your inbox is not full, and you check your spam folder. If no email arrives, consider using an alternative email.
You will need a Premium plan to perform your action!
Note: If you already have a premium account, please log in to access our services as usual.

Plans & Pricing

Our mission is to make quality education accessible and free for everyone.
However, to keep our hardworking team running and this service alive, we genuinely need your support!
By opting for a premium plan, not only do you sustain us in achieving the mission, but you also unlock advanced features to enrich your learning experience.

Free

For learners who aren't pressed for time

What's included on Free
1000+ IELTS Tests & Samples
Instant IELTS Writing Task 1 & 2 Evaluation (2 times/month)
Instant IELTS Speaking Part 1, 2, & 3 Evaluation (5 times/month)
Instant IELTS Writing Task 1 & 2 Essay Generator (2 times/month)
500+ Dictation & Shadowing Exercises
100+ Pronunciation Exercises
Flashcards
Other Advanced Tools

Premium

For those serious about advancing their English proficiency, and for IELTS candidates aspiring to boost their band score by 1-2 points (especially in writing & speaking) in just 30 days or less

What's included on Premium
Save Your IELTS Test Progress
Unlock All Courses & Content
Unlimited AI Conversations
Unlimited AI Writing Enhancement Exercises
Unlimited IELTS Writing Task 1 & 2 Evaluation
Unlimited IELTS Speaking Part 1, 2, & 3 Evaluation
Checked Answers Will Not Be Published
Unlimited IELTS Writing Task 1 & 2 Essay Generator
Unlimited IELTS Speaking Part 1, 2, & 3 Sample Generator
Unlimited Usage Of Advanced Tools

Due to the nature of our service and the provided free trials, payments are non-refundable.
Nếu bạn là người Việt Nam và không có hoặc không muốn trả bằng credit/debit cards, bạn có thể thanh toán bằng phương thức chuyển khoản:


Chọn gói:
279,000₫ 157,000 ₫ cho gói 1 tháng (chỉ 5,233₫/ngày)
819,000₫ 397,000 ₫ cho gói 3 tháng (chỉ 4,411₫/ngày)
1,649,000₫ 667,000 ₫ cho gói 6 tháng (chỉ 3,706₫/ngày)
3,299,000₫ 857,000 ₫ cho gói 12 tháng (chỉ 2,381₫/ngày)


Sau khi chuyển khoản, vui lòng đợi trình duyệt tự động điều hướng bạn trở lại Engnovate và bạn sẽ ngay lập tức nhận được mã kích hoạt tài khoản premium.
Nếu có lỗi xảy ra, bạn có thể liên hệ với team thông qua một trong các phương thức: email đến helloengnovate@gmail.com hoặc nhắn tin qua facebook.com/engnovate.
Vì toàn bộ công cụ trên website đều có thể sử dụng thử miễn phí, Engnovate không hỗ trợ hoàn tiền.