Our system will evaluate the answer based on this AI-generated description.
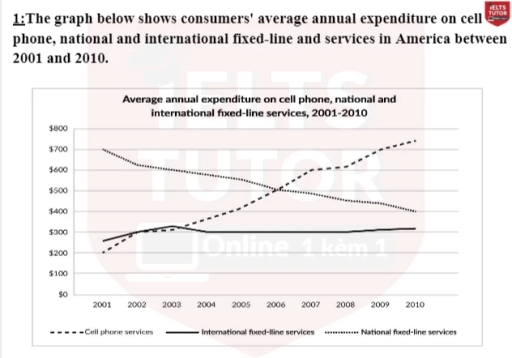
The image depicts the average annual expenditure by consumers on three types of communication services in America from 2001 to 2010: cell phone services, national fixed-line services, and international fixed-line services. In 2001, expenditures were approximately $200 for cell phone services, $700 for national fixed-line services, and $300 for international fixed-line services. By 2010, cell phone services rose to approximately $750, national fixed-line services dropped to roughly $400, and international fixed-line services decreased to around $100. Expenditures on cell phone services consistently increased, surpassing national fixed-line services in 2006. National fixed-line services showed a steady decline throughout the period. International fixed-line services displayed a gradual decrease over the years. All values are depicted on a common monetary scale from $0 to $800.
Given the complexity of the image, the above description may not be entirely accurate.
Skyrocket your IELTS band score by 1-2 points in under a month with our premium plan!
Note: Both the topic and the answer were created by one of our users.
The line graph illustrates the average yearly amount of money spent on books, technology and clothes in Someland over a period of 9 year years, starting from 2011.
Overall, during most of the period, Clothes recorded the lowest figure. In addition, the expenditure on Books and Clothes witnessed an upward trend while the figure for Technology declined significantly
In 2011, the highest figure can be seen in the expense on Technology at roughly $350. The amount of money spent on Technology dropped considerably to about $250 between 2011 and 2016. This was followed by a slight fall to precisely $200 in 2020
In contrast, the expenditure on Books and Clothes saw an increase over the period shown. In 2011, Books spending recorded the lowest figure. However, the expenditure on Books experienced a four-folds increase to approximately $400 and was the highest figure in 2020. Additionally, there was a minimally growth in the spending on Clothes from slightly over $200 of $100 to nearly $150 between 2011 and 2012 before remaining unchanged at around $150 over the next 8 years
Word Count: 179
