Our system will evaluate the answer based on this AI-generated description.
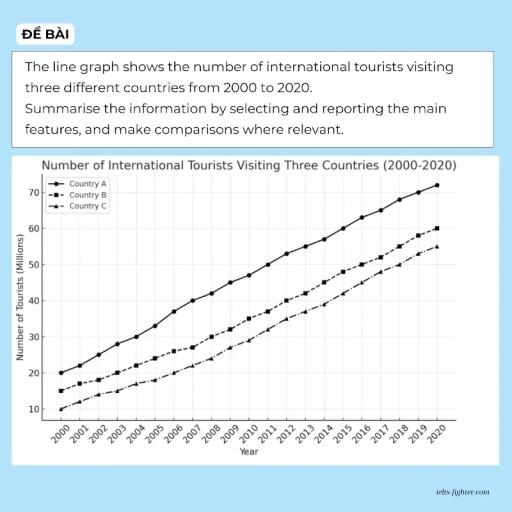
The image displays a line graph titled 'Number of International Tourists Visiting Three Countries (2000-2020)', with the number of tourists measured in millions. For Country A, the data points are: 20 (2000), 22 (2001), 24 (2002), 28 (2003), 30 (2004), 33 (2005), 37 (2006), 40 (2007), 42 (2008), 45 (2009), 48 (2010), 50 (2011), 53 (2012), 55 (2013), 57 (2014), 60 (2015), 63 (2016), 66 (2017), 68 (2018), 70 (2019), and 72 (2020). For Country B, the corresponding figures are: 15 (2000), 17 (2001), 18 (2002), 20 (2003), 22 (2004), 24 (2005), 26 (2006), 27 (2007), 30 (2008), 32 (2009), 35 (2010), 37 (2011), 40 (2012), 42 (2013), 45 (2014), 47 (2015), 50 (2016), 52 (2017), 54 (2018), 57 (2019), and 60 (2020). For Country C, the numbers are: 10 (2000), 12 (2001), 14 (2002), 15 (2003), 17 (2004), 18 (2005), 20 (2006), 22 (2007), 24 (2008), 26 (2009), 29 (2010), 31 (2011), 33 (2012), 35 (2013), 37 (2014), 39 (2015), 42 (2016), 45 (2017), 48 (2018), 52 (2019), and 55 (2020).
Given the complexity of the image, the above description may not be entirely accurate.
Skyrocket your IELTS band score by 1-2 points in under a month with our premium plan!
Note: Both the topic and the answer were created by one of our users.
The line graph illustrates the number of visitors going to three main tourist destinations over the course of 35 years since 1990.
In general, there were a consistent and steady increase across 3 attractions over the surveyed time. The figure for travellers visiting place A maintained the leading position for 35 years, followed by place B and C, respectively.
Specifically, there was a significant growth in the number of people travelling to attraction A, with the rise from 10 million to nearly 22.5 million individuals. A similar trend was seen in both destination B and C, although to a lesser extent. Place B experienced a drastic increase, between over 7.5 million people in 1990 and approximately 19 million in 2025; while place C saw an over threefold growth in the quantity of tourists, from 5 million in 1990 to excessively 15 million in 2025.
These trends across three destinations A,B and C showed an increase in tourism and recreational area, which contributed to regional economic development.
Word Count: 166