Our system will evaluate the answer based on this AI-generated description.
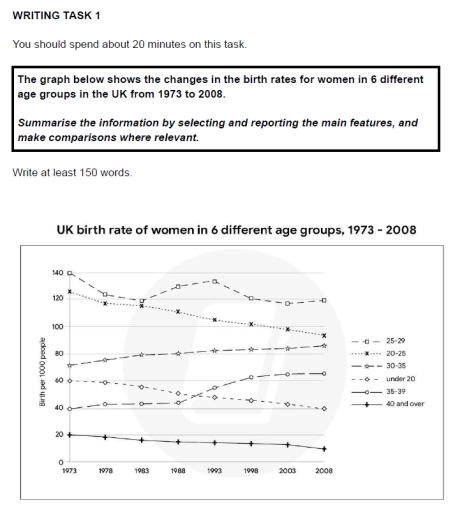
The image depicts UK women's birth rates from 1973 to 2008 in age groups: 25-29, 20-24, 30-35, under 20, 35-39, and 40 and over. In 1973, 25-29 had 140, 20-24 had 130, 30-35 had around 65, under 20 had 50, 35-39 had 25, and 40 and over had about 5. In 1978, 25-29 was 125, 20-24 was 100, 30-35 was 57, under 20 was 45, 35-39 was 25, 40 and over was about 5. By 1983, 25-29 was 110, 20-24 was 90, 30-35 was 60, under 20 was about 45, 35-39 was 25, 40 and over was around 5. In 1988, 25-29 was 115, 20-24 was 85, 30-35 was 60, under 20 was about 45, 35-39 was 25, 40 and over was around 6. By 1993, 25-29 was 112, 20-24 was 65, 30-35 was about 57, under 20 was 42, 35-39 was 25, 40 and over was around 8. In 1998, 25-29 was 100, 20-24 was 55, 30-35 was about 55, under 20 was 42, 35-39 was 30, and 40 and over was 10. By 2003, 25-29 was 102, 20-24 was about 55, 30-35 was 66, under 20 was 41, 35-39 was 40, 40 and over was about 12. In 2008, 25-29 was 98, 20-24 was 52, 30-35 was 95, under 20 was 40, 35-39 was 45, 40 and over was 16.
Given the complexity of the image, the above description may not be entirely accurate.
Skyrocket your IELTS band score by 1-2 points in under a month with our premium plan!
Note: Both the topic and the answer were created by one of our users.
The line graph illustrates the birth rate of females between 1973 and 2020 in the United Kingdom. Overall, is appreciated that giving birth has suffered a decrease over the last half-century.
Firstly, is seen that 20 teenagers per each 1000 had babies in that period, slightly falling to 18 in 2001. Secondly, youth, between 20 and 25 years old, which were the ones with the highest rate, plummeted from 120 to 20 per thousand in 50 years, reaching the third position in the ranking. On the contrary, those aged between 28 and 34, were the only group that increased, becoming the principal, doubling in less than 10 years and hitting the peak in 2020 at 80 births per thousand. Lastly, women older than 40 years old, gradually fell from 10 to 5 per 1000 in that period, being the group that gives birth the least.
To summarize, the figure shows a general decreasing trend during the past 50 years, indicating that nowadays are not the youngest females who have more babies.
Word Count: 171
