Our system will evaluate the answer based on this AI-generated description.
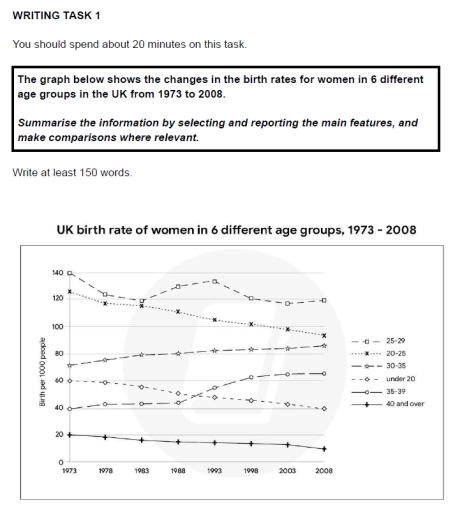
The image depicts UK women's birth rates from 1973 to 2008 in age groups: 25-29, 20-24, 30-35, under 20, 35-39, and 40 and over. In 1973, 25-29 had 140, 20-24 had 130, 30-35 had around 65, under 20 had 50, 35-39 had 25, and 40 and over had about 5. In 1978, 25-29 was 125, 20-24 was 100, 30-35 was 57, under 20 was 45, 35-39 was 25, 40 and over was about 5. By 1983, 25-29 was 110, 20-24 was 90, 30-35 was 60, under 20 was about 45, 35-39 was 25, 40 and over was around 5. In 1988, 25-29 was 115, 20-24 was 85, 30-35 was 60, under 20 was about 45, 35-39 was 25, 40 and over was around 6. By 1993, 25-29 was 112, 20-24 was 65, 30-35 was about 57, under 20 was 42, 35-39 was 25, 40 and over was around 8. In 1998, 25-29 was 100, 20-24 was 55, 30-35 was about 55, under 20 was 42, 35-39 was 30, and 40 and over was 10. By 2003, 25-29 was 102, 20-24 was about 55, 30-35 was 66, under 20 was 41, 35-39 was 40, 40 and over was about 12. In 2008, 25-29 was 98, 20-24 was 52, 30-35 was 95, under 20 was 40, 35-39 was 45, 40 and over was 16.
Given the complexity of the image, the above description may not be entirely accurate.
Skyrocket your IELTS band score by 1-2 points in under a month with our premium plan!
Note: Both the topic and the answer were created by one of our users.
The line graph illustrates how much the birth rates for women in 6 various ages in the Britain changed between 1973 and 2008.
Overall,it is evident that the birth rate of young women aged 25-29 fluctuated over the period,but still had the higher level compared to other groups of females.Meanwhile the rate of pregnancy in other ages such as 20-25,40 and over,and under 20 witnessed gradual decline at the end of the period.However there are 2 groups of women ages that in contrast showed a significant increase.
In 1973,the birth rate of those who are 25-29 stood at the highest level(140).But during the period it vary around 140 and 120.And eventually end at just below 120.Whereas the rate of ages as 30-35 showed slow rise to 85 from 70.The level of women aged 35-39 start at 40 by 1973,but after 4 years in 1988 it significantly increased to just over 60.
The birth rate of females aged 20-25 stood at 129,however it fell steadily over the 8-year period to 92.The level of other groups of ages such as under 20 and 40 and over also witnessed a slow decrease.For example,the rate of women with under 20 ages showed drop from 60 to 40.Whereas ages as 40 and over declined to 10 from 20.
Word Count: 213
