Our system will evaluate the answer based on this AI-generated description.
The image shows a line graph titled "The sales of six essential products in WeBuy in the first half of 2020" with quantities in thousands on the y-axis ranging from 0 to 60 and months from January to June on the x-axis. There are six lines representing different products: Books & movies start at 10 in January, peak at 20 in February, drop to 10 in March, rise slightly to 15 in April and May, and drop to 5 in June; Cleaning supplies and toiletries begin at 15 in January, jump to 50 in February, fall to 30 in March, 20 in April, 25 in May, and 10 in June; Clothing starts at 30 in January, drops to 25 in February, rises sharply to 60 in March, then plummets to 20 in April, 10 in May, and 5 in June; Electronics starts at 5 in January, rises to 10 in February and March, surges to 55 in April, falls to 40 in May, and plunges to 5 in June; Food & Beverages starts at 15 in January, rises to 35 in February, peaks at 40 in March, drops to 10 in April, soars to 45 in May, and falls to 25 in June; Medical Supplies start at 15 in January, rapidly ascend to 60 in February, remain at 60 in March, fall to 35 in April, 25 in May, and 10 in June.
Given the complexity of the image, the above description may not be entirely accurate.
Skyrocket your IELTS band score by 1-2 points in under a month with our premium plan!
Note: Both the topic and the answer were created by one of our users.
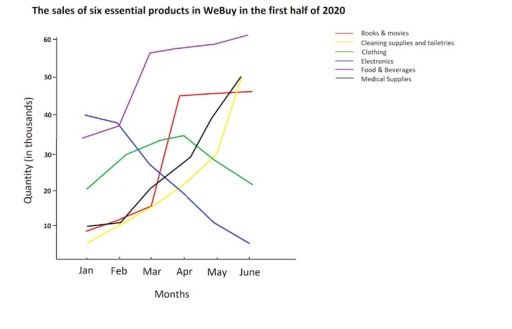
The information concerning the data about six indispensable products were sold in WEBUY in the first six months of 2020.It has been manifested that, the sales of clothing witnessed fluctuation trend throughout the given period of time.
To commence with,33000 food and beverages being sold in the January month in the 2020.Moreover, the sales of food and beverages showed an upward trend from 35 thousand to 57 thousand between February to may month. Interestingly, this line reached to all time high of 60000 in June month. Furthermore, the sales of cleaning supplies and toiletries were 5000 to 50000 between January and June ,respectively. Surprisingly ,the sales of books and movies were minimally went up from 10000 to 14000 from January to march. After this, this line increased significantly and terminated at48000 in the June 2020.
Moving further, the sales of clothing witnessed hovered trend from January to June month. After that, the line of electronics started at 40 thousand and rapidly dropped down and ends at 5000 in June month. The sales of medical supplies were10000 in first two months of 2020. After this, it was escalated sharply and ended at 49000 in the June month of 2020.
It has been evident that, the sales of food beverages and the books and movies were showed the same upward trend over the given period of time.
Word Count: 225