Our system will evaluate the answer based on this AI-generated description.
The image features two bar graphs comparing percentages across Canada, France, Germany, Italy, Japan, UK, US from 2000-2007 and 2008-2012. For 2000: Canada 4%, France 3%, Germany 3%, Italy 3%, Japan 3%, UK 3.5%, US 4.2%. 2001: Canada 1.2%, France 2%, Germany 1.2%, Italy 2%, Japan -0.5%, UK 2.5%, US 1.5%. 2002: Canada 2.5%, France 1%, Germany 0.2%, Italy 0.2%, Japan -0.5%, UK 2.5%, US 2%. 2003: Canada 2%, France 1%, Germany -0.2%, Italy 0.2%, Japan 1.5%, UK 4%, US 2.5%. 2004: Canada 2.25%, France 1.5%, Germany 0.5%, Italy 1%, Japan 2.25%, UK 3.5%, US 3.75%. 2005: Canada 2.75%, France 2%, Germany 0.75%, Italy 0.8%, Japan 1%, UK 2.5%, US 3.5%. 2006: Canada 2.8%, France 2.5%, Germany 3.5%, Italy 1.5%, Japan 2.5%, UK 2.9%, US 2.8%. 2007: Canada 3%, France 2.25%, Germany 2.8%, Italy 1.5%, Japan 2.25%, UK 2.6%, US 2.1%. 2008: Canada 0.75%, France -0.2%, Germany -0.2%, Italy -1%, Japan -1%, UK -0.5%, US -0.6%. 2009: Canada -2.5%, France -2.5%, Germany -1.5%, Italy -6%, Japan -5.5%, UK -3.8%, US -2.5%. 2010: Canada 3%, France 1.25%, Germany 3.75%, Italy 1.5%, Japan 3%, UK 1.25%, US 2.5%. 2011: Canada 2.1%, France 2%, Germany 2.5%, Italy 1.75%, Japan -0.5%, UK 1.25%, US 1.4%. 2012: Canada 1.75%, France 0%, Germany 0.5%, Italy -3%, Japan 2%, UK 0.3%, US 1.8%.
Given the complexity of the image, the above description may not be entirely accurate.
Skyrocket your IELTS band score by 1-2 points in under a month with our premium plan!
Note: Both the topic and the answer were created by one of our users.
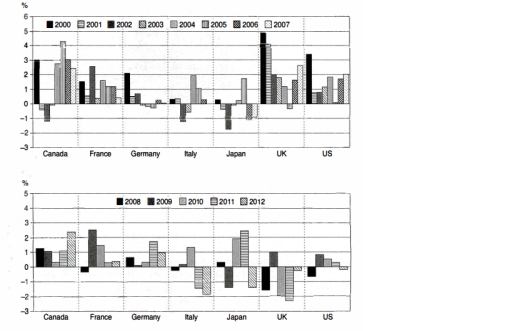
The bar charts show wage growth in the G7 countries during two time periods: 2000-2007 and 2008-2012.
Overall, wages increased more in the first period, while the second period shows lower growth and more negative figures. The UK had the strongest wage growth in both periods, while Japan had the weakest results.
In 2000-2007, most countries experienced positive wage growth. The UK showed the highest increases, reaching around 5-6% in some years. Canada and the US also had steady positive growth, mostly between 1% and 3%. France increased slightly, while Germany and Italy had mixed results, including some small decreases. Japan performed the worst, with negative wage growth almost every year.
In the second period, 2008-2012, wage growth became much lower. Many countries, such as Italy, Germany, and especially Japan, showed negative figures in several years. The UK continued to perform well and was the only country with strong positive growth during this time, reaching almost 4% in 2010. Other countries, including Canada, France, and the US, had small increases but less growth compared to the earlier period.
Word Count: 178
