Our system will evaluate the answer based on this AI-generated description.
The image displays a five-stage process diagram of how bottled and canned carbonated drinks are made. Stage 1, titled "Water cleaning," includes a flow depicting raw water undergoing filtration, water softening through chemicals, and pumping. Stage 2, "Heating evaporation and carbonation," shows cooling pipes and electric heaters connected to a carbon dioxide source, indicating carbonation. Stage 3, labeled "Mixing," features a mixing tank where coloring, syrup, and flavor are added to the carbonated water. Stage 4, named "Filtering and Filling," illustrates filtered liquid being filled into bottles and cans. The final Stage 5, "Packaging," portrays the bottled and canned drinks being boxed and subsequently transported to a supermarket. Each stage is interlinked with arrows, emphasizing the progression of the production process.
Given the complexity of the image, the above description may not be entirely accurate.
Skyrocket your IELTS band score by 1-2 points in under a month with our premium plan!
Note: Both the topic and the answer were created by one of our users.
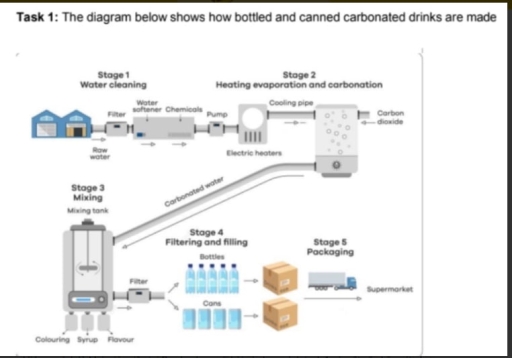
The diagram illustrates the process used to manufacture bottled and canned carbonated drinks.
In the first stage, raw water is passed through a filter and then treated with a water softener and chemicals in order to remove impurities. After this, the cleaned water is pumped to electric heaters, where it is heated. The hot water then flows through a cooling pipe before entering a carbonation chamber, in which carbon dioxide is added to produce carbonated water.
Next, in stage three, the carbonated water is transferred to a mixing tank. At this point, colouring, syrup and flavour are added and thoroughly mixed to form the final drink.
In stage four, the mixture is filtered once again and then poured into two types of containers: bottles and cans. In the final stage, both bottled and canned drinks are packed into boxes and transported by truck to supermarkets for sale.
Word Count: 147