🔥 Today Only: Save 30% on Premium — Offer Ends Soon! - Upgrade Now!
Bar Chart

Band 5+: The graph shows the results of a survey of British public figures that people can recognise from their photographs. Summarise the information by selecting and reporting the main features, and make comparisons where relevant. You should spend about 20 minutes on this task.

Image for topic: The graph shows the results of a survey of British public figures that people can recognise from their photographs. Summarise the information by selecting and reporting the main features, and make comparisons where relevant. You should spend about 20 minutes on this task.
Our system will evaluate the answer based on this AI-generated description.
The image is a bar graph depicting recognition of a person in a photo by age. The horizontal axis shows percentages ranging from 0 to 100%, and the vertical axis lists four categories: Queen, Prime Minister, Chancellor, and Mayor of London. There are four bars for each category, representing age groups 0-20, 21-40, 41-60, and 61-older. The Queen has the highest recognition, with all age groups above 90%, except for 0-20 at approximately 85%. Prime Minister recognition is also high, with the 61-older group at nearly 100%, 41-60 around 90%, 21-40 near 80%, and 0-20 just above 60%. Chancellor recognition is lower, with 61-older around 65%, 41-60 near 55%, 21-40 approximately 45%, and 0-20 just below 20%. Mayor of London has varied recognition, with 61-older at nearly 70%, 41-60 around 60%, 21-40 just above 40%, and 0-20 at approximately 35%.
Given the complexity of the image, the above description may not be entirely accurate.
Note: Both the topic and the answer were created by one of our users.

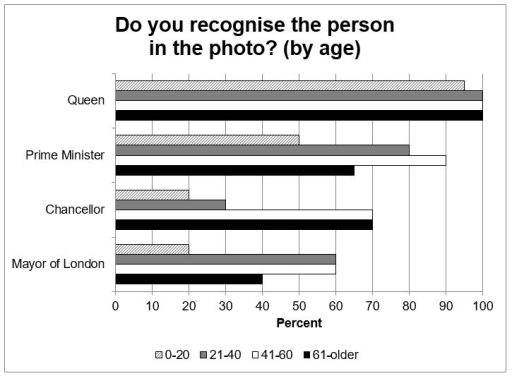
The bar chart illustrates results of a social experiment that helded among the British public by showing pictures of governtment officials whether they recognise or not in a different age groups.

Overal, it can be clearly seen that the most well known person was the leader of this nation, while, Mayor of London was the lowest recognised at that time.

In this survey only first age group from 0-20 was stood 5 percent lower from maximum as other groups who are knew the Queen of the Britain by her seeing her picture. Afterwards, Prime Minister was more well known between the 41-60 aged people by 90% while, another team in 21-40 was showed only 10% dip and there is a slight difference between 0-20 and 60 older participants with 50% and approximately 60% respectively.

There are visually similarities between Chancellor and Mayor of London because Chancellor was famous for the elderly generations who were older then 41 with reaching 70 percent. After this 60 percent of the survey attendence between the ages 0 to 40 were stood at the highest point who knew Mayor of London

Word Count: 186

Answers On The Same Topic:

The graph shows the results of a survey of British public figures that people can recognise from their photographs. Summarise the information by selecting and reporting the main features, and make comparisons where relevant. You should spend about 20 minutes on this task.

The provided graph elucidates data about people at varying ages who recognize well-known individuals’ pictures in a British survey. Overall, the picture of the Queen is the leader , whereas the opposite pattern can be observed at the Mayor of London’s. Moreover, the figure for the queen stands out its other competitors, regarding all aged […]

The graph shows the results of a survey of British public figures that people can recognise from their photographs. Summarise the information by selecting and reporting the main features, and make comparisons where relevant. You should spend about 20 minutes on this task.

The bar chart illustrates the results of a social experiment held among the British public, showing pictures of government officials to see whether they recognized them or not, across different age groups. Overall, it can be clearly seen that the most well-known person was the leader of this nation, while the Mayor of London was […]

The graph shows the results of a survey of British public figures that people can recognise from their photographs. Summarise the information by selecting and reporting the main features, and make comparisons where relevant. You should spend about 20 minutes on this task.

The bar graph presents the findings of a survey assessing the recognizability of notable British public figures based on age demographics. Overall, the British monarchy, represented by the Queen, exhibits the highest level of recognizability across all age groups, while the Chancellor and the Mayor of London rank lower in public identification. In detail, the […]

The graph shows the results of a survey of British public figures that people can recognise from their photographs. Summarise the information by selecting and reporting the main features, and make comparisons where relevant. You should spend about 20 minutes on this task.

The bar chart illustrates the outcome of a survey about British famous celebrities who can be recognised by their photos. In general, people between the age of 41-60 show the most recognition about British public figures while people from 0-20 often show the converse. The queen of Britain is recognised the most by the public […]

See All

Other Topics:

The chart below shows the annual number of rentals and sales (in various formats ) of films from a particular store between 2002 and 2011

the chart illustrates on the unnual number of rentals and sales in different formats of films from a particular store between 2002 and 2011. The DVD sales from 2004 to 2011, overall, is holding the first place however, the rentals are not exception, nonetheless this sale decreased domestically over the years and the VHS as […]

The chart below give attendance figures for Grandville stadium from which are project in 2030 after a major improvement project.

The bar chart presented below shows the annual attendance at Grandville Stadium from 2017 to 2030 for three different types of events. Overall, attendance is expected to increase over the period for all three categories, namely theater, sporting events, and concerts. In addition, sporting events are expected to remain the category with the highest number […]

The diagram below shows predicted and actual average attendances in football stadiums of some of the biggest clubs in the Premier League. Summarize the information by selecting and reporting the main features and make comparisons where relevant.

The diagram illustrates the ratio of estimated and actual attendance of some of the large clubs in the Premier League at the football stadium. Overall, it is seen that Manchester United’s fans attended more than it was hoped and Aston Villa witnessed the lowest presence, even lower than the expectation at the soccer stadium. Regarding […]

The chart below shows the number of households in the US by their annual income in 2007, 2022 and 2015. Summarise the information by selecting and reporting the main features and make comparisons where relevant.

The bar chart compares the number of households in five different categories in the US by their annual income in 2007,2011 and 2015 . It is clear that the highest number of US households by yearly income in 100000 and more. By contrast, the lowest proportion of expenditure on 75000-99999$ throughout the period. In terms […]

The chart below shows the number of households in the US by their annual income in 2007, 2022 and 2015. Summarise the information by selecting and reporting the main features and make comparisons where relevant.

The bar chart compares the number of households in five different categories in the US by their annual income in 2007 , 2011 and 2015 . It is clear that the highest number of US households by yearly income in 100000 and more. By contrast, the lowest proportion of expenditure on 75000-99999$ throughout the period. […]

The chart below shows the global sales of different kinds of digital games from 2000 to 2006. Summarise and make comparisons wherever necessary.

The supplied bar chart depicts the comparison of the global sales of different kinds of digital games such as mobile phone games and online games , in 07 years from 2000 to 2006. A glance at the graph reveals that most sold games in these seven years is the handheld games , while , the […]

See All
We have detected unusual activity on your device.
Please verify your identity to continue.
Note: This verification step won't sign you in. If you have a premium account, please log in to access the service as usual.
Google/Gmail Verification
Or verify using Email/Code
We've sent a verification code to:
youremail@gmail.com (Not your email?)
Enter it below to complete the verification process.
Ensure your email address is correct, your inbox is not full, and you check your spam folder. If no email arrives, consider using an alternative email.
You will need a Premium plan to perform your action!
Note: If you already have a premium account, please log in to access our services as usual.

Plans & Pricing

Our mission is to make quality education accessible for everyone.
However, to keep our hardworking team running and this service alive, we genuinely need your support!
By opting for a premium plan, not only do you sustain us in achieving the mission, but you also unlock advanced features to enrich your learning experience.

Free

For learners who aren't pressed for time

What's included on Free
100+ Cambridge IELTS Tests
Instant IELTS Writing Task 1 & 2 Evaluation (2 times/month)
Instant IELTS Speaking Part 1, 2, & 3 Evaluation (5 times/month)
Instant IELTS Writing Task 1 & 2 Essay Generator (2 times/month)
500+ Dictation & Shadowing Exercises
100+ Pronunciation Exercises
Flashcards
Other Advanced Tools

Premium

For those serious about advancing their English proficiency, and for IELTS candidates aspiring to boost their band score by 1-2 points (especially in writing & speaking) in just 30 days or less

What's included on Premium
Save Your IELTS Test Progress
Unlock All Courses & IELTS Tests
Unlimited AI Conversations
Unlimited AI Writing Enhancement Exercises
Unlimited IELTS Writing Task 1 & 2 Evaluation
Unlimited IELTS Speaking Part 1, 2, & 3 Evaluation
Checked Answers Will Not Be Published
Unlimited IELTS Writing Task 1 & 2 Essay Generator
Unlimited IELTS Speaking Part 1, 2, & 3 Sample Generator
Unlimited Usage Of Advanced Tools
Priority Support within 24h (12-month plan only)

Due to the nature of our service and the provided free trials, payments are non-refundable.
Nếu bạn là người Việt Nam và không có hoặc không muốn trả bằng credit/debit cards, bạn có thể thanh toán bằng phương thức chuyển khoản:


Chọn gói:
419,000₫ 277,000 ₫ cho gói 1 tháng (chỉ 9,233₫/ngày)
1,239,000₫ 597,000 ₫ cho gói 3 tháng (chỉ 6,633₫/ngày)
2,469,000₫ 1,027,000 ₫ cho gói 6 tháng (chỉ 5,706₫/ngày)
4,929,000₫ 1,417,000 ₫ cho gói 12 tháng (chỉ 3,936₫/ngày)


Sau khi chuyển khoản, vui lòng đợi trình duyệt tự động điều hướng bạn trở lại Engnovate và bạn sẽ ngay lập tức nhận được mã kích hoạt tài khoản premium.
Nếu có lỗi xảy ra, bạn có thể liên hệ với team thông qua một trong các phương thức: email đến helloengnovate@gmail.com hoặc nhắn tin qua facebook.com/engnovate.
Vì toàn bộ công cụ trên website đều có thể sử dụng thử miễn phí, Engnovate không hỗ trợ hoàn tiền.