Our system will evaluate the answer based on this AI-generated description.
The image illustrates export metrics from 2000 to 2010 in three categories: Agricultural, Industrial, Others, measured in metric tons. In 2000, Agricultural exports were 3 metric tons, Industrial exports were 1 metric ton, and Others were 2 metric tons. By 2001, Agricultural increased to 5, Industrial to 2, and Others to 2. For 2002, Agricultural was 4, Industrial reached 3, and Others slightly declined to 3. In 2003, Agricultural dropped back to 3, Industrial was at 4, and Others also at 3. By 2004, Agricultural plummeted to 1, Industrial held steady at 4, Others at 4. In 2005, Agricultural was at 1, Industrial raised to 5, Others went to 5. For 2006, Agricultural saw a rise to 3, Industrial remained at 5, Others fell to 3. In 2007, Agricultural increased to 4, Industrial decreased to 4, Others dropped to 2. In 2008, Agricultural exports were 3, Industrial's were consistent at 5, and Others at 2. By 2009, Agricultural decreased further to 2, Industrial reached 7, Others were stable at 2. Finally, in 2010, Agricultural exports dropped to 1, Industrial surged to 8, and Others slightly decreased to 1 metric ton.
Given the complexity of the image, the above description may not be entirely accurate.
Skyrocket your IELTS band score by 1-2 points in under a month with our premium plan!
Note: Both the topic and the answer were created by one of our users.
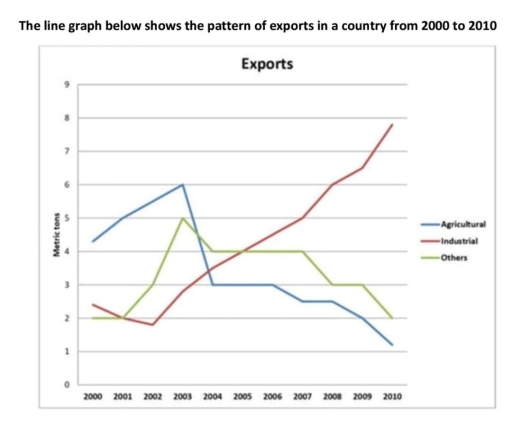
The graph illustrates the volume of exports in one country between 2000 and 2010.
Even though, industrial export was one of the less volume-recorded phases, it has witnessed a sharp growth until 2010. However, agricultural export was the highest exported volume, which decreased steadily by the end of the decade.
In 2000, industrial export showed 2.5 in metric tons. Nevertheless, it declined a little in 2002 to just under the two. Following to this, it increased sharply to 7.9 from 2002 to 2010.
In contrast, the other groups showed significant decreases. At the start, agricultural export reported 4.2. It went up to six in 2003 before going down next year. Notably, there was not any change between 2004 and 2006. Then, it dived slightly from three to 1.1 during the next four years. Other phases was two in the initial year and did not showed a change during a year. However, it then grew to five before going down to four. Between 2004 and late 2007 export of the other sectors stayed unchangeable. Finally, it decreased step by step from 2007 to 2010.
Word Count: 183