Our system will evaluate the answer based on this AI-generated description.
The image contains a line graph titled "The number of XYZ radio station listeners since 1940 with projections until 2030" with a y-axis in "Thousands" and an x-axis showing years. The data points for (year, thousands of listeners) are approximately: (1940, 22), (1950, 55), (~1956, 105), (1960, 20), (~1965, 45), (1970, 45), (~1978, 45), (1980, 15), (~1984, 32), (1990, 22), (~1995, 33), (2000, 20), (2010, 23), (2020, 50), (~2028, 80), and (2030, 80). Also shown are two numbered lists: 1. mild fluctuations, 2. a peak, 3. a period of instability, 4. a significant increase, 5. a partial growth, 6. a record high, 7. figures climbing back, and 8. a marked rise, 9. a dramatic decrease, 10. a period of slight volatility, 11. a leveling out, 12. a sharp decline, 13. a plateau, 14. figures remaining constant. An example text related to numbers 1 and 5 states that from 1980 to 2000, the number of listeners ranged between 11 and 35, and a subsequent partial growth reached almost 25 thousand people.
Given the complexity of the image, the above description may not be entirely accurate.
Skyrocket your IELTS band score by 1-2 points in under a month with our premium plan!
Note: Both the topic and the answer were created by one of our users.
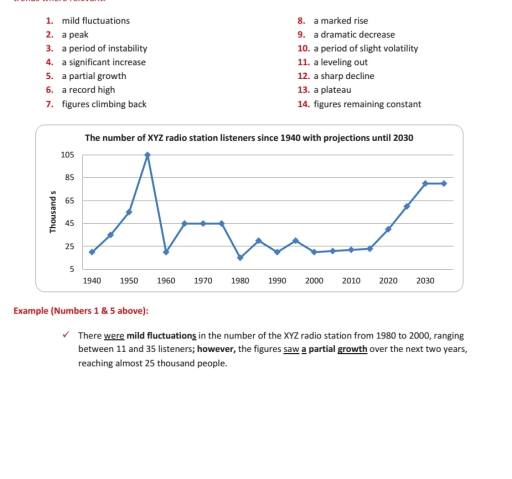
The line graph shows the number of XYZ radio station listeners from 1940 to 2030, including future projections.
Overall, the number of listeners had a lot of changes. There was a record high in the middle of the period, but after that the figures went down sharply and then showed some recovery again in recent years.
In 1940, the number of listeners was quite low, around 20 thousand. After that, there was a marked rise between 1940 and 1955, reaching about 50 thousand. Then the figures increased very fast and reached a peak of around 105 thousand in 1960.
However, after this peak, there was a dramatic decrease and the number dropped to nearly 20 thousand. From 1960 to 1980, the graph shows some mild fluctuations and a period of instability, staying mostly between 20 and 45 thousand.
Later, from 1980 to 2000, the numbers were quite low with small ups and downs, showing a leveling out around 15-25 thousand. After 2010, there was again a significant increase, and the figures are expected to keep rising, reaching about 80 thousand by 2030.
Word Count: 182