You should spend about 20 minutes on this task. Write at least 150 words.
You should spend about 20 minutes on this task.
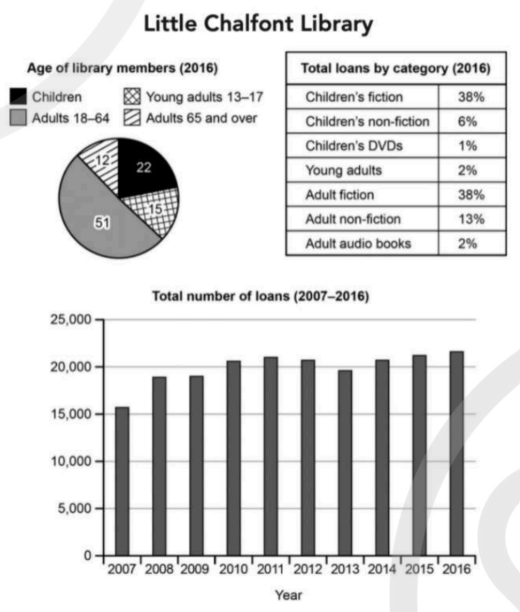
The charts below give information about a public library in a town called Little Chalfont. Summarise the information by selecting and reporting the main features, and make comparisons where relevant.
Samples
Words: 0
More Samples:
Part 1
Tip: Press F11 (Windows) or Ctrl+Cmd+F (Mac) to cycle between normal, focus, and fullscreen modes.
The Cambridge IELTS Academic series uses authentic past papers from the official exam creators, making it the most reliable way to practice. Because the material closely matches the real Academic exam in format, logic, and difficulty, it is the best category to start with if you want a true exam experience.
BAND 8.0 The pie chart and table illustrate a community library in a town named Little Chalfont, and the line graph provides information about the entirety of loans between 2007 and 2016. Overall, it is evident that the total number of loans experienced significant fluctuations throughout the period; however, children’s fiction was the primary category, while children’s DVDs was the lowest figure among all categories. As depicted in the pie chart, adults accounted for just over half of the total members in the library, at 51%, whereas adults 65 and over were the lowest member’s age bracket. Furthermore, the second most prevalent age category was children at 22%, while young adults between 13 and 17 represented 15% of the total in 2016. Moreover, children’s fiction and adult non-fiction accounted for 38% respectively. Following that, adult non-fiction was the second widespread segment among all categories, while the remaining four categories, including children’s non-fiction and adult audio books, collectively accounted for less than 10% of the total. On the other hand, the total number of loans stood at just over 15,000 in 2007. Subsequently, this figure demonstrated significant fluctuations until the end of the period. By the end of the timeframe, this figure had reached a peak of approximately 22,000.
The chart illustrates the details of a public library, which is located in a town entitled Little Chalfont.
Overall, it explains that the graph, which was mainly for adults, had a higher proportion of membership, while the least amount of loan spending was on children’s DVDs.
Moving to the bar chart, only twenty thousand was the largest figure in the total number of loans across the period. In the pie chart, many members are adults around 18-64. However, children’s fiction and adult non-fiction take a maximum loan, which is around 38%. Children’s DVDs have taken a minimum loan of 1%.
On the other hand, each category is moderate in 2016. Moreover, the graph shows that the number of loans reached its highest point at 20,300 at that time in 2016. With regard to the total number of loans, the information remained almost the same, starting from 15,000 in 2007. After that, the data showed a gradual rise until 2016, with a slight drop in 2013 from just below 20,000.
The given data illustrate the category and number of loans and members about a public library named Little Chalfont in a specific town.
Overall, the children and the adults aged between 18 and 64 jointly dominated the memberships and loans by category in 2016 while the total number of loans steadily grew over the whole period (2007-2016).
In 2016, more than half of all members were adults aged from 18 to 64 while the 22% of memebers were the children. The pie chart clearly states the dominance of the adult subscribers over the library. The table demonstrates the percentages of loans by categories and shows that the children’s and adult fiction shared the equal portion of the loans. Even though the number of child members were less than half of the adult, the library granted the same share of the loans regarding the child ficion.
The bar chart depicts the number of loans granted from the year 2007 to 2016 where approximately 16,000 loans were allocated in 2007 but the numbers saw a steady rise to around 22,000 in 2011. Then the amount of loans slightly fluctuated till the year 2014 and reached to its peak by about 23,000 in 2016.
The charts illustrate information about the age of members, categories of loans, and total loans in the Little Chalfont library.
Overall, the number of members in the Little Chalfont library shows that adult members make up a larger portion than other age groups, and children’s fiction and adult fiction have a similar number, becoming the largest total loans by category in 2016. On the other hand, the largest total number of loans occurred in 2016.
The first pie chart shows that adults between 18 and 64 years old are the major members, with 51%, followed by children with 22%, and the table of loans by category provides the information that children’s fiction and adult fiction have a large number, with a similar value of 38% in 2016.
Meanwhile, the chart of the total number of loans from 2007 to 2016 shows the largest number of loans in 2016, with approximately 22,000, followed by 2015, which has an identical pattern to 2011, with more than 21,000.
Band 8
The charts illustrate the market segments in terms of age and current trends at the public library located in a town called Little Chalfont.
In summary, the most common members are adults and kids. The most trending genres are children’s fiction and adult non-fiction. The number of loans from 2007 to 2016 remained quite stable.
According to the first chart, which illustrates the age of library members, half of them are individuals aged from 18 to 64, while teenagers aged from 13 to 17 are less likely to attend the library.
The second table shows that 76 percent of total borrows are equally divided between children’s fiction and adult non-fiction. In contrast, children’s DVDs are the least popular category taken by customers.
The latest total number of loans is approximately 22,000 units, which is the highest amount in the period from 2007 to 2016. While the lowest one took place in 2007 at roughly 16,000. Overall, the number of borrowings did not fluctuate that much; on the contrary, it was stable throughout the years.
The chart presents the total figure of borrowed items in Little Chalfont Library. It also shows the ages of borrowers, the items most commonly loaned in 2016, and the total number of loans from 2007 to 2016.
Overall, the largest proportion of borrowers in the library are adults aged 18–64, while adults aged 65 and above make up the smallest group. Adult fiction and children’s fiction are the most popular loaned items, whereas children’s DVDs are the least borrowed. The total number of loans fluctuated slightly throughout the years, with 2007 having the lowest figure and 2016 the highest.
In the pie chart, adults aged 18–64 account for 51% of the total population of library borrowers, followed by children, who make up 22%. Young adults aged 13–17 represent 15%, while adults aged 65 and above are the least common borrowers at 12%.
In the table, adult fiction and children’s fiction tie as the most popular loaned items at 38%. This is followed by adult non-fiction at 13% and children’s non-fiction at 6%, which is almost half of the adult non-fiction figure. Young adult books, adult audiobooks, and children’s DVDs are the least popular categories.
The bar chart shows the total number of loans from 2007 to 2016. In 2007, loans began at around 16,000, followed by a slight increase in the next two years to approximately 19,000. In 2010–2012, the figures rose marginally to between 20,000 and 22,000, with a minor decrease to 19,000 in the following year. In 2014–2016, the numbers remained steady, ending at around 23,000.
The charts below shows the age of library members and loans by category in one year.
Overall, adults accounted for the highest proportion of users of the library while the young adults and children made up the smallest proportion coupled with a significant fiction of borrowing whereas the total number of loans had fluctuations throughout the year.
To begin with, in terms of demographics, the largest population of the library users were adults aged 18-65 years old with 51% followed by children with a proportion of 22% respectively. Conversely, senior adults mere 11% of memeberships. This shows that adults and children are the most common people that find the library fascinating compared to the senior adults.
Regarding borrowing patterns in 2016, children fiction and adults fiction were both 38% making a total of 76% collectively. In contrast, adult non-fiction and children non-fiction was 13% and 6% while young adults and adult audio books had 2% respectively. The bar chart analysis shows a gradual increase in loans from 15,000 in 2007 to 20,000 in 2011. However, the numbers started to flactuate in 2012 to 16 making the loans trend go upward.
band 8
The charts illustrate information about a public library in Little Chalfont, including the age distribution of members in 2016, the types of items borrowed in the same year, and the number of loans between 2007 and 2016.
Overall, the 18-64 aged group constituted the largest proportion of members. Fiction was the most common category for both children and adult. Moreover, the number of loans tended to increase from 2007 to 2016.
In 2016, adults from 18 to 64 years old accounted for 51%, over half of all memberships. Children ranked second, reaching 22%, whereas young adults and those aged 65 and over had 15% and 12% respectively. In terms of types of books, fiction was the most popular category for both children and adults, each accounting for 38%. Non-fiction categories were less common, reaching 13% for adult and only 6% for children. Children’s DVDs constituted the smallest share, at only 1%.
The number of items borrowed rose from over 15,000 to approximately 22,000 between 2007 and 2016. Although there was a slight fluctuation in 2013, materials borrowed generally increased steadily during the period.
You will need a Premium plan to perform your action!
Note: If you already have a premium account, please log in to access our services as usual.
Plans & Pricing
Our mission is to make quality education accessible for everyone. However, to keep our hardworking team running and this service alive, we genuinely need your support! By opting for a premium plan, not only do you sustain us in achieving the mission, but you also unlock advanced features to enrich your learning experience.
For those serious about advancing their English proficiency, and for IELTS candidates aspiring to boost their band score by 1-2 points (especially in writing & speaking) in just 30 days or less
What's included on Premium
Save Your IELTS Test Progress
Unlock All Courses & IELTS Tests
Unlimited AI Conversations
Unlimited AI Writing Enhancement Exercises
Unlimited IELTS Writing Task 1 & 2 Evaluation
Unlimited IELTS Speaking Part 1, 2, & 3 Evaluation
Due to the nature of our service and the provided free trials, payments are non-refundable.
Nếu bạn là người Việt Nam và không có hoặc không muốn trả bằng credit/debit cards, bạn có thể thanh toán bằng phương thức chuyển khoản:
Chọn gói:
419,000₫277,000 ₫ cho gói 1 tháng(chỉ 9,233₫/ngày)
1,239,000₫597,000 ₫ cho gói 3 tháng(chỉ 6,633₫/ngày)
2,469,000₫1,027,000 ₫ cho gói 6 tháng(chỉ 5,706₫/ngày)
4,929,000₫1,417,000 ₫ cho gói 12 tháng(chỉ 3,936₫/ngày)
Sau khi chuyển khoản, vui lòng đợi trình duyệt tự động điều hướng bạn trở lại Engnovate và bạn sẽ ngay lập tức nhận được mã kích hoạt tài khoản premium.
BAND 8.0 The pie chart and table illustrate a community library in a town named Little Chalfont, and the line graph provides information about the entirety of loans between 2007 and 2016. Overall, it is evident that the total number of loans experienced significant fluctuations throughout the period; however, children’s fiction was the primary category, while children’s DVDs was the lowest figure among all categories. As depicted in the pie chart, adults accounted for just over half of the total members in the library, at 51%, whereas adults 65 and over were the lowest member’s age bracket. Furthermore, the second most prevalent age category was children at 22%, while young adults between 13 and 17 represented 15% of the total in 2016. Moreover, children’s fiction and adult non-fiction accounted for 38% respectively. Following that, adult non-fiction was the second widespread segment among all categories, while the remaining four categories, including children’s non-fiction and adult audio books, collectively accounted for less than 10% of the total. On the other hand, the total number of loans stood at just over 15,000 in 2007. Subsequently, this figure demonstrated significant fluctuations until the end of the period. By the end of the timeframe, this figure had reached a peak of approximately 22,000.
Can you guide me how you improving your writing task.?
The chart illustrates the details of a public library, which is located in a town entitled Little Chalfont.
Overall, it explains that the graph, which was mainly for adults, had a higher proportion of membership, while the least amount of loan spending was on children’s DVDs.
Moving to the bar chart, only twenty thousand was the largest figure in the total number of loans across the period. In the pie chart, many members are adults around 18-64. However, children’s fiction and adult non-fiction take a maximum loan, which is around 38%. Children’s DVDs have taken a minimum loan of 1%.
On the other hand, each category is moderate in 2016. Moreover, the graph shows that the number of loans reached its highest point at 20,300 at that time in 2016. With regard to the total number of loans, the information remained almost the same, starting from 15,000 in 2007. After that, the data showed a gradual rise until 2016, with a slight drop in 2013 from just below 20,000.
BAND 6.5 sample answer
get 11 band in ielts
The given data illustrate the category and number of loans and members about a public library named Little Chalfont in a specific town.
Overall, the children and the adults aged between 18 and 64 jointly dominated the memberships and loans by category in 2016 while the total number of loans steadily grew over the whole period (2007-2016).
In 2016, more than half of all members were adults aged from 18 to 64 while the 22% of memebers were the children. The pie chart clearly states the dominance of the adult subscribers over the library. The table demonstrates the percentages of loans by categories and shows that the children’s and adult fiction shared the equal portion of the loans. Even though the number of child members were less than half of the adult, the library granted the same share of the loans regarding the child ficion.
The bar chart depicts the number of loans granted from the year 2007 to 2016 where approximately 16,000 loans were allocated in 2007 but the numbers saw a steady rise to around 22,000 in 2011. Then the amount of loans slightly fluctuated till the year 2014 and reached to its peak by about 23,000 in 2016.
Got 6
got band 5
The charts illustrate information about the age of members, categories of loans, and total loans in the Little Chalfont library.
Overall, the number of members in the Little Chalfont library shows that adult members make up a larger portion than other age groups, and children’s fiction and adult fiction have a similar number, becoming the largest total loans by category in 2016. On the other hand, the largest total number of loans occurred in 2016.
The first pie chart shows that adults between 18 and 64 years old are the major members, with 51%, followed by children with 22%, and the table of loans by category provides the information that children’s fiction and adult fiction have a large number, with a similar value of 38% in 2016.
Meanwhile, the chart of the total number of loans from 2007 to 2016 shows the largest number of loans in 2016, with approximately 22,000, followed by 2015, which has an identical pattern to 2011, with more than 21,000.
Band 8
The charts illustrate the market segments in terms of age and current trends at the public library located in a town called Little Chalfont.
In summary, the most common members are adults and kids. The most trending genres are children’s fiction and adult non-fiction. The number of loans from 2007 to 2016 remained quite stable.
According to the first chart, which illustrates the age of library members, half of them are individuals aged from 18 to 64, while teenagers aged from 13 to 17 are less likely to attend the library.
The second table shows that 76 percent of total borrows are equally divided between children’s fiction and adult non-fiction. In contrast, children’s DVDs are the least popular category taken by customers.
The latest total number of loans is approximately 22,000 units, which is the highest amount in the period from 2007 to 2016. While the lowest one took place in 2007 at roughly 16,000. Overall, the number of borrowings did not fluctuate that much; on the contrary, it was stable throughout the years.
The chart presents the total figure of borrowed items in Little Chalfont Library. It also shows the ages of borrowers, the items most commonly loaned in 2016, and the total number of loans from 2007 to 2016.
Overall, the largest proportion of borrowers in the library are adults aged 18–64, while adults aged 65 and above make up the smallest group. Adult fiction and children’s fiction are the most popular loaned items, whereas children’s DVDs are the least borrowed. The total number of loans fluctuated slightly throughout the years, with 2007 having the lowest figure and 2016 the highest.
In the pie chart, adults aged 18–64 account for 51% of the total population of library borrowers, followed by children, who make up 22%. Young adults aged 13–17 represent 15%, while adults aged 65 and above are the least common borrowers at 12%.
In the table, adult fiction and children’s fiction tie as the most popular loaned items at 38%. This is followed by adult non-fiction at 13% and children’s non-fiction at 6%, which is almost half of the adult non-fiction figure. Young adult books, adult audiobooks, and children’s DVDs are the least popular categories.
The bar chart shows the total number of loans from 2007 to 2016. In 2007, loans began at around 16,000, followed by a slight increase in the next two years to approximately 19,000. In 2010–2012, the figures rose marginally to between 20,000 and 22,000, with a minor decrease to 19,000 in the following year. In 2014–2016, the numbers remained steady, ending at around 23,000.
The charts below shows the age of library members and loans by category in one year.
Overall, adults accounted for the highest proportion of users of the library while the young adults and children made up the smallest proportion coupled with a significant fiction of borrowing whereas the total number of loans had fluctuations throughout the year.
To begin with, in terms of demographics, the largest population of the library users were adults aged 18-65 years old with 51% followed by children with a proportion of 22% respectively. Conversely, senior adults mere 11% of memeberships. This shows that adults and children are the most common people that find the library fascinating compared to the senior adults.
Regarding borrowing patterns in 2016, children fiction and adults fiction were both 38% making a total of 76% collectively. In contrast, adult non-fiction and children non-fiction was 13% and 6% while young adults and adult audio books had 2% respectively. The bar chart analysis shows a gradual increase in loans from 15,000 in 2007 to 20,000 in 2011. However, the numbers started to flactuate in 2012 to 16 making the loans trend go upward.
band 8
The charts illustrate information about a public library in Little Chalfont, including the age distribution of members in 2016, the types of items borrowed in the same year, and the number of loans between 2007 and 2016.
Overall, the 18-64 aged group constituted the largest proportion of members. Fiction was the most common category for both children and adult. Moreover, the number of loans tended to increase from 2007 to 2016.
In 2016, adults from 18 to 64 years old accounted for 51%, over half of all memberships. Children ranked second, reaching 22%, whereas young adults and those aged 65 and over had 15% and 12% respectively. In terms of types of books, fiction was the most popular category for both children and adults, each accounting for 38%. Non-fiction categories were less common, reaching 13% for adult and only 6% for children. Children’s DVDs constituted the smallest share, at only 1%.
The number of items borrowed rose from over 15,000 to approximately 22,000 between 2007 and 2016. Although there was a slight fluctuation in 2013, materials borrowed generally increased steadily during the period.