Our system will evaluate the answer based on this AI-generated description.
The image presents two charts detailing monthly climate data for Brisbane and Canberra. The line chart, 'Average daily temperatures in two Australian cities', shows Brisbane's maximum temperature (°C) as: Jan 29, Feb 30, Mar 28, Apr 26, May 23, Jun 21, Jul 21, Aug 22, Sep 24, Oct 26, Nov 27, Dec 29, and its minimum as: Jan 21, Feb 21, Mar 20, Apr 17, May 14, Jun 11, Jul 10, Aug 11, Sep 13, Oct 16, Nov 18, Dec 20. For Canberra, the maximum temperatures (°C) are: Jan 28, Feb 27, Mar 24, Apr 20, May 16, Jun 12, Jul 11, Aug 13, Sep 16, Oct 19, Nov 23, Dec 26, and the minimums are: Jan 13, Feb 13, Mar 11, Apr 7, May 4, Jun 2, Jul 1, Aug 2, Sep 4, Oct 7, Nov 9, Dec 12. The bar chart, 'Average number of days with rainfall in two Australian cities', shows Brisbane's rainfall days per month as: Jan 13, Feb 14, Mar 14, Apr 12, May 10, Jun 7, Jul 7, Aug 7, Sep 7, Oct 8, Nov 10, Dec 12. For Canberra, the values are: Jan 7, Feb 7, Mar 8, Apr 7, May 7, Jun 10, Jul 10, Aug 10, Sep 9, Oct 10, Nov 10, Dec 7.
Given the complexity of the image, the above description may not be entirely accurate.
Skyrocket your IELTS band score by 1-2 points in under a month with our premium plan!
Note: Both the topic and the answer were created by one of our users.
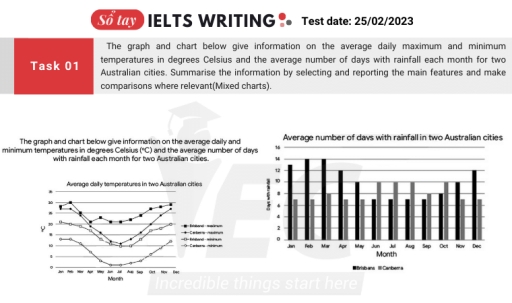
The line graph below depicts information about average daily temperatures into Australian cities, whereas the bar chart gives data about average number of rainy days in same cities.
Overall temperatures in both cities are highest at the beginning and end of the year and fall to their lowest levels in the middle of the year. additionally, Brisbane generally experience more days with rainfall than Canberra.
In Brisbane the highest temperature is in February then it decreases until July. Following this it rises again towards December. although, the temperatures differ slightly, both cities follow a similar pattern over the year. a similar Trend can be observed in Canberra. the highest temperature is recorded in January while the lowest occurs in July despite this results Canberra generally records lower temperatures than Brisbane.
Turning to the second chart the days was rainfall in both cities are quite different. Brisbane starts the year and ends with monsters full of rain. the number of rainy days speaks in February in and March then decreases gradually until August before Rising again towards December. in contrast, Canberra experiences fever rainy days throughout the year remaining relatively stable at around 7 to 10 days per month
Word Count: 198