24 Hours Only: Get 39% OFF on Our Premium Plan - Check Out Now!
Bar Chart

Band 5+: hillary's school sampled and equal number of boys and girls at the school asking them to pick the one. Summarise the information by selecting and reporting the main features and make comparisons where relevant

Image for topic: hillary's school sampled and equal number of boys and girls at the school asking them to pick the one. Summarise the information by selecting and reporting the main features and make comparisons where relevant
Our system will evaluate the answer based on this AI-generated description.
The image shows a bar graph titled "Figure 5. Preferred snack choices of students at Hillary's high school"; it compares the number of students by gender who prefer various snacks. Categories include Candy, Chips, Chocolate bars, Cookies, Crackers, Fruit, Ice cream, Popcorn, Pretzels, and Vegetables, with boys and girls represented by bars side by side. Candy: girls 250, boys slightly above 200; Chips: girls slightly above 250, boys 250; Chocolate bars: girls 200, boys slightly below 200; Cookies: girls slightly above 150, boys 225; Crackers: girls slightly above 100, boys 200; Fruit: girls slightly below 175, boys slightly below 100; Ice cream: girls slightly above 225, boys 200; Popcorn: girls 150, boys slightly below 150; Pretzels: girls 125, boys slightly below 125; Vegetables: girls 100, boys 50. The x-axis is labeled "Number of students" with a scale from 0 to 300 in increments of 50; y-axis lists the snack categories.
Given the complexity of the image, the above description may not be entirely accurate.
Note: Both the topic and the answer were created by one of our users.

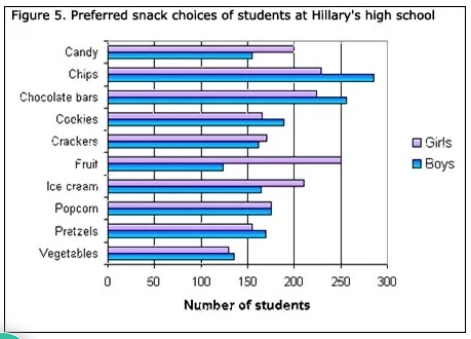
In the double stranded horizontal bar, Hillary’s school researched on students in same proportion of each gender, allowing them to choose the snacks they want to eat. This graph shows the number of students on lower side and various kind of light-meals on vertical side.

It can be seen that maximum number of boys, 280, fond of chips while 250 girls picked fruits, also the males were only the half portion of the girls in fruit selection. The second most population of males was 260 in consuming chocolate bars and around 230 girls took a look after boys in choosing the same as well as chips. Not more than 140 children showed interest in vegetables in both sexes, also these were the least took edible items in girls population. There was not significant difference found in selecting popcorn. The males were slightly ahead from females in choosing cookies and pretzels whereas females remain in front of boys when they were picking ice-cream and candy.

To sum up, all of the items were favoured by 100 students of bothe sexes. While chips topped the list, fruits were the last.

Word Count: 188

Other Topics:

the chart below show the percentage of people in a city in the UK using the internet for different activities in 2007 and 2009.

The chart provides the proportion of people in a city in the UK who used the internet for various activities in 2007 and 2009. Overall, shopping was the most widely used in both years while watching TV and learning were among the least common. Most activities experienced slight changes over the period. In 2007, there […]

The chart below shows the percentage of youth population in 1985 and 2008. Summarise the information by selecting and reporting the main features, and make comparisons where relevant. Write at least 150 words.

The bar chart represents the trends in youth population aged 14 years and below in percentages in 1985 and 2008. Overall, although the percentages were all higher than 15%, the percentage has decreased to less than15% to just over 35% in 2008. In 1985, youth population in Italy, Euro Area and United Kingdom were all […]

The chart gives information about the number and purposes of trips made by men and women in one year in a certain European country.

The bar chart illustrates the number and purposes of trips made by both men and women in one year in a particular European country. Overall, the figure for men who travelled to work was the highest, while women mainly favored shopping compared to the others. Notably, the number of day trips made by both genders […]

The chart provides information about healthcare expenditure across five countries in 2002.

The provided chart depicts the proportion of GDP spent on healthcare in Japan, Italy, Germany, France, and the USA in the year 2002. Overall, the French healthcare expenditure accounted for the largest part of its GDP in both public and private sectors. Meanwhile, the total spending on healthcare for Japan was the lowest among all […]

The chart below shows the annual number of rentals and sales(in various formats)of films from particular store between 2002 and 2011.

This bar chart provids key information about the annual number of rentals and sales in different formats of movies , from particular shop between 2002 and 2011. Overall , it is clear from the graph that number of DVD sales was the lowest at the beginning , then increased to be the highest on majority […]

The chart below shows the percentage of population who went to watch live sports events in one country

The chart summarizes the percentage number of population watching live sports over years in one country , but with different types of sports. Overall, swimming had the lowest participation, while football was the most popular sport, and cycling was ranked in the middle . As well as, each sport show its changing over years, for […]

See All
We have detected unusual activity on your device.
Please verify your identity to continue.
Note: This verification step won't sign you in. If you have a premium account, please log in to access the service as usual.
Google/Gmail Verification
Or verify using Email/Code
We've sent a verification code to:
youremail@gmail.com (Not your email?)
Enter it below to complete the verification process.
Ensure your email address is correct, your inbox is not full, and you check your spam folder. If no email arrives, consider using an alternative email.
You will need a Premium plan to perform your action!
Note: If you already have a premium account, please log in to access our services as usual.

Plans & Pricing

Our mission is to make quality education accessible and free for everyone.
However, to keep our hardworking team running and this service alive, we genuinely need your support!
By opting for a premium plan, not only do you sustain us in achieving the mission, but you also unlock advanced features to enrich your learning experience.

Free

For learners who aren't pressed for time

What's included on Free
1000+ IELTS Tests & Samples
Instant IELTS Writing Task 1 & 2 Evaluation (2 times/month)
Instant IELTS Speaking Part 1, 2, & 3 Evaluation (5 times/month)
Instant IELTS Writing Task 1 & 2 Essay Generator (2 times/month)
500+ Dictation & Shadowing Exercises
100+ Pronunciation Exercises
Flashcards
Other Advanced Tools

Premium

For those serious about advancing their English proficiency, and for IELTS candidates aspiring to boost their band score by 1-2 points (especially in writing & speaking) in just 30 days or less

What's included on Premium
Save Your IELTS Test Progress
Unlock All Courses & Content
Unlimited AI Conversations
Unlimited AI Writing Enhancement Exercises
Unlimited IELTS Writing Task 1 & 2 Evaluation
Unlimited IELTS Speaking Part 1, 2, & 3 Evaluation
Checked Answers Will Not Be Published
Unlimited IELTS Writing Task 1 & 2 Essay Generator
Unlimited IELTS Speaking Part 1, 2, & 3 Sample Generator
Unlimited Usage Of Advanced Tools

Due to the nature of our service and the provided free trials, payments are non-refundable.
Nếu bạn là người Việt Nam và không có hoặc không muốn trả bằng credit/debit cards, bạn có thể thanh toán bằng phương thức chuyển khoản:


Chọn gói:
279,000₫ 157,000 ₫ cho gói 1 tháng (chỉ 5,233₫/ngày)
819,000₫ 397,000 ₫ cho gói 3 tháng (chỉ 4,411₫/ngày)
1,649,000₫ 667,000 ₫ cho gói 6 tháng (chỉ 3,706₫/ngày)
3,299,000₫ 857,000 ₫ cho gói 12 tháng (chỉ 2,381₫/ngày)


Sau khi chuyển khoản, vui lòng đợi trình duyệt tự động điều hướng bạn trở lại Engnovate và bạn sẽ ngay lập tức nhận được mã kích hoạt tài khoản premium.
Nếu có lỗi xảy ra, bạn có thể liên hệ với team thông qua một trong các phương thức: email đến helloengnovate@gmail.com hoặc nhắn tin qua facebook.com/engnovate.
Vì toàn bộ công cụ trên website đều có thể sử dụng thử miễn phí, Engnovate không hỗ trợ hoàn tiền.