Our system will evaluate the answer based on this AI-generated description.
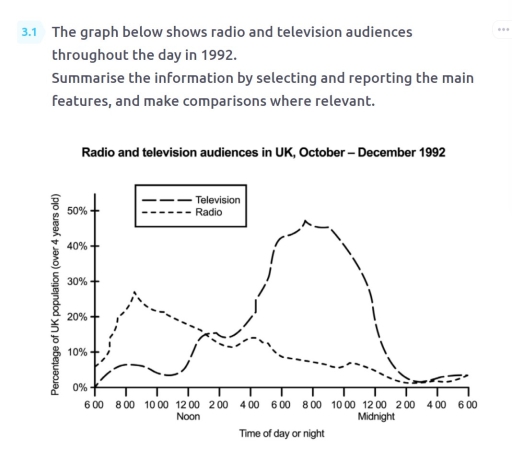
The image displays a line graph titled "Radio and television audiences in UK, October – December 1992", plotting "Time of day or night" on the x-axis (measured in 2-hour increments from 6 AM to 6 AM the next day) against "Percentage of UK population (% of 4+ years old)" on the y-axis (ranging from 0% to 50% in 10% increments). The graph features two lines labeled Television (solid line) and Radio (dashed line). The Television line shows audience percentage starting around 10% at 6 AM, gradually increasing to reach the first peak of 25% at 10 AM, dipping to 15% by 12 PM noon, rising sharply to reach the highest peak close to 45% at 8 PM, and then declining steadily to around 5% by 6 AM the next day. The Radio line begins around 25% at 6 AM, with a sharp increase to approximately 30% by 8 AM, followed by a consistent decline to 10% at 4 PM, a slight increase to 15% at 6 PM, and then a gradual decrease back to around 10% by 6 AM the following day.
Given the complexity of the image, the above description may not be entirely accurate.
Skyrocket your IELTS band score by 1-2 points in under a month with our premium plan!
Note: Both the topic and the answer were created by one of our users.
The line graph illustrates the percentage of radio and television audience in the UK, time of day and night, in 1992.
Overall, both audience show a fluctuation over the period, showed nearly the same a low percent in the end of the period.
At 6 a.m. no one watch TV, while nearly 7% population of the UK use radio. After 2 hours, radio users increased to about 26%, TV users consisted a minor percentage, low than 10%. Near to the lunch, at 1 p.m. two audiences meet at approximately 15%.
Following hours, audiences showed various direction: television audience started a sharp rise, while radio users started a gradual decrease. By the evening, at 8 p.m. television audience peaked at about 46%, in contrast radio audience continued decline. By 2 p.m TV users plunged to 3% and radio users with a difference of 1% to about 2%. After 1 hour, they had the second meet at approximately 2.5%. In the subsequent hours, it is forecasted to an increase for radio audience and a decrease for TV audience.
Word Count: 176
