Our system will evaluate the answer based on this AI-generated description.
The image displays a bar chart titled "UK telephone calls, by category, 1995-2002" with the x-axis representing years from 1995 to 2002 and the y-axis indicating percentage from 0 to 100%. The chart is divided into three categories of call types: Local - fixed line, National and international - fixed line, and Mobiles (all calls). Each year from 1995 to 2002 shows a sequential decline in the percentage of Local - fixed line calls, starting at roughly 61% in 1995 and decreasing to about 36% in 2002. National and international - fixed line calls remained fairly consistent throughout the period, starting at approximately 38% in 1995 and fluctuating slightly to around 37% in 2002. Mobile calls (all calls) show an increase from about 1% in 1995 to roughly 27% in 2002. Each year is represented by three bars corresponding to each category, placed side by side for comparative analysis.
Given the complexity of the image, the above description may not be entirely accurate.
Skyrocket your IELTS band score by 1-2 points in under a month with our premium plan!
Note: Both the topic and the answer were created by one of our users.
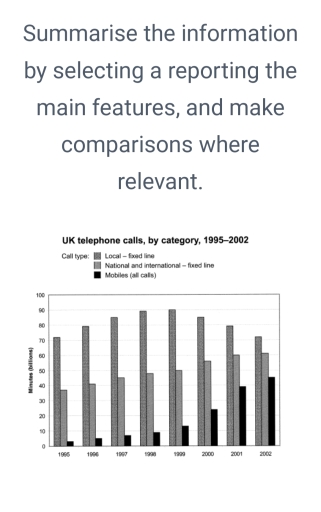
The given Chart illustrates the total amount of minutes (in billion) of telephone calls in the UK separated into three different types, over a Period of 10 years from 1995 to 2002.
Overall, it is clear that Phone calls via local fixed line was the highest used category during this period, whereas, mobile calls were the lowest one. But after a certain time it witnessed a rapid increase.
As can be seen, People of the uk used local fixed line calls at about 72 billion minutes in the Year of 1995, while, the figure for National and International fixed line were just half of the local line at around 38 million minutes. on the other hand, the ammount of mobile calls were nearly 4 billon minutes.
It could also be observed that, all the three types were on an upward trend during
the following four years from 1995 to 1998. Subsequently, in 1999 the use of local fixed line reached a Peak at 90 billion minutes. After that, it showed a downward trend. However, mobile calls experienced a dramatic increase between 2000 to 2002 when national and international fixed line increased steadily.
Word Count: 192