Our system will evaluate the answer based on this AI-generated description.
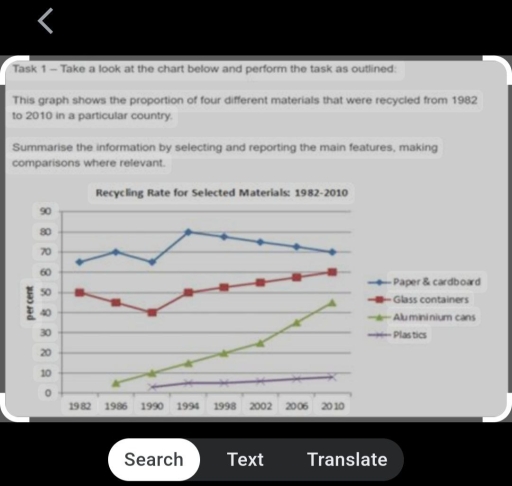
The image displays a line graph with data on the recycling rates for four materials from 1982 to 2010: paper & cardboard, glass containing, aluminum cans, and plastics. The rates in 1982 were: paper & cardboard 65%, glass containers 50%, aluminum cans 5%, plastics 0%. For 1986: paper & cardboard 67%, glass containers 50%, aluminum cans 5%, plastics 0%. For 1990: paper & cardboard 70%, glass containers 52%, aluminum cans 10%, plastics 2%. For 1994: paper & cardboard 74%, glass containers 52%, aluminum cans 20%, plastics 3%. For 1998: paper & cardboard 80%, glass containers 60%, aluminum cans 25%, plastics 5%. For 2002: paper & cardboard 82%, glass containers 69%, aluminum cans 40%, plastics 9%. For 2006: paper & cardboard 85%, glass containers 72%, aluminum cans 45%, plastics 10%. For 2010: paper & cardboard 90%, glass containers 75%, aluminum cans 45%, plastics 12%.
Given the complexity of the image, the above description may not be entirely accurate.
Skyrocket your IELTS band score by 1-2 points in under a month with our premium plan!
Note: Both the topic and the answer were created by one of our users.
The given line graph depicts the percentage of four various materials that were recycled from 1982 to 2010 in a individual nation.
Overall, it is evident that the paper and cardboards were recycled more than the other materials, whereas the least percentage of plastics were recycled throughout the period.
To begin with, In 1982, 65% of paper and cardboards were recycled, while the figure was followed an upward trent and reached at its peak at 80% in 1994. Between 1998 to 2010, the percentage was decreased slighty to 70%. Moreover, the recycling figure of glass containers were declined gradually from 1982 to 1990 to 40%, whereas from1994 to 2010, it rose to 60%.
Furthermore, In 1984, 5% of aluminium cans were recycled. The percentage was climed dramtically from 1990 to 2010 to 45%. In addition, plastics were recycled only 3% in 1990, while the figure was followed an upward trent between 1994 to 2010 and reached at its peak at 9% in 2010.
Word Count: 163
