Our system will evaluate the answer based on this AI-generated description.
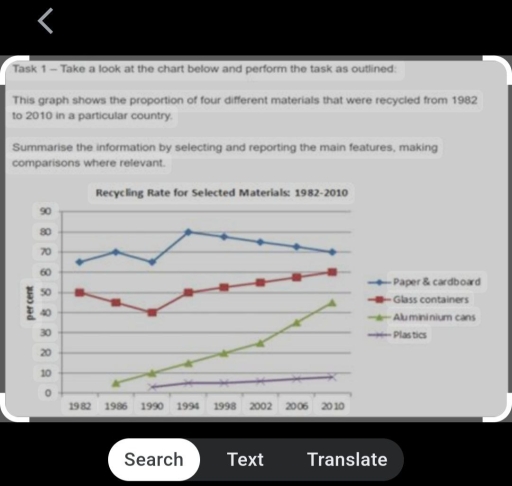
The image displays a line graph with data on the recycling rates for four materials from 1982 to 2010: paper & cardboard, glass containing, aluminum cans, and plastics. The rates in 1982 were: paper & cardboard 65%, glass containers 50%, aluminum cans 5%, plastics 0%. For 1986: paper & cardboard 67%, glass containers 50%, aluminum cans 5%, plastics 0%. For 1990: paper & cardboard 70%, glass containers 52%, aluminum cans 10%, plastics 2%. For 1994: paper & cardboard 74%, glass containers 52%, aluminum cans 20%, plastics 3%. For 1998: paper & cardboard 80%, glass containers 60%, aluminum cans 25%, plastics 5%. For 2002: paper & cardboard 82%, glass containers 69%, aluminum cans 40%, plastics 9%. For 2006: paper & cardboard 85%, glass containers 72%, aluminum cans 45%, plastics 10%. For 2010: paper & cardboard 90%, glass containers 75%, aluminum cans 45%, plastics 12%.
Given the complexity of the image, the above description may not be entirely accurate.
Skyrocket your IELTS band score by 1-2 points in under a month with our premium plan!
Note: Both the topic and the answer were created by one of our users.
The given line chart depicts the percentage of four different materials which underwent recycling between 1982 and 2010 in a specific country.
Overall, it is noticeable that paper and cardboard were recycled most while the plastics stood as an opposite category.
Unlike the rest of the materials, plastics were only recycled starting from 1990, at around 4%. It showed a relatively stable trend where there were only slight changes throughout the timeline. The process of aluminimum cans recycling initiated in 1986 at 0.04 rate where it showed an increasing trend. In 2002, the percent soared significantly till it reached 45% in 2010. The glass containers took up half of the recyling where it dropped by one-tenth in 1990. However, its trend inclined back to 60% in 2010. Lastly, paper and carboard were mostly recycled where it demonstrated a fluctuating trend. Starting around at 65% , it hit the peak at four-fifths in 1994. It later declined by 0.01 in 2010.
In conclusion, by the difference of 4 years analysis for more than two decades, paper and carboard were recycled and reused back at the highest rate.
Word Count: 186
