Our system will evaluate the answer based on this AI-generated description.
The image displays a line graph charting the vehicle production time in hours per vehicle for Nissan, Daimler Chrysler (DC), General Motors (GM), and Ford from 1998 to 2002. In 1998, Nissan starts just above 32 hours, Daimler Chrysler at 32 hours, General Motors just under 32 hours, and Ford at 30 hours. By 1999, Nissan's production time decreases sharply to 29 hours, Daimler Chrysler continues at 27 hours, General Motors reduces to 28 hours, and Ford drops steeply to 22 hours. In 2000, Nissan further reduces to under 28 hours, Daimler Chrysler moves to 27 hours, General Motors drops to 27 hours, and Ford maintains at 22 hours. In 2001, Nissan's production comes slightly above 26 hours, Daimler Chrysler rises to approximately 28 hours, General Motors increases slightly to 26 hours, and Ford remains around 22 hours. By 2002, Nissan decreases to 22 hours, Daimler Chrysler slightly drops to above 27 hours, General Motors stays under 26 hours, and Ford achieves 21 hours.
Given the complexity of the image, the above description may not be entirely accurate.
Skyrocket your IELTS band score by 1-2 points in under a month with our premium plan!
Note: Both the topic and the answer were created by one of our users.
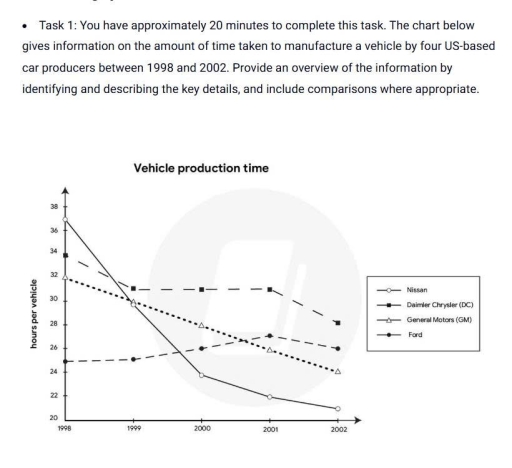
The line graph illustrates the amount of time taken to manufacture a vehicle by four US-based car producers over the period of 4 years, starting from 1998
Overall, it is evident that the production time of ford experienced an upward trend, while Nissan and General Motors underwent a decline. In addition, Daimler Chrysler remained the highest production during the period shown.
In 1998, the production time of Nissan was highest, around 37 hours per vehicle. Daimler Chrysler was also high, at approximately 34 hours, while General Motors took around 33 hours and the lowest production time was ford just under 26 hours.
From 1999 to 2002, the production time of Nissan,Daimler Chryler and General Motors all declined slightly, except for ford. Nissan decreased steadily from 37 to under 22 hours. Similarly, general motors witnessed a downward trend, reaching about 24 hours. Daimler Chrysler oscillated between 34 and under 30 hours per vehicle. In contrast, ford was the only one increased. The production time of ford gradually rose, reaching about 27 hours in 2002.
In conclusion, Nissan became the fastest manufacture in 2002, while Daimler Chrysler remained slowest. The other categories showed small change.
Word Count: 193