🔥 Today Only: Save 30% on Premium — Offer Ends Soon! - Upgrade Now!
Bar Chart

Band 4+: The bar chart below shows the international student enrolments at three universities.

Image for topic: The bar chart below shows the international student enrolments at three universities.
Our system will evaluate the answer based on this AI-generated description.
The image contains a bar graph titled "International Student Enrollments" with the y-axis labeled "Number of students" with a range from 0 to 8000 and the x-axis labeled "Student's country of origin" with five countries listed: India, Nepal, Vietnam, Indonesia, and Colombia. There are three sets of bars for each country, representing three different universities: Smithtown University, University of Riverview, and Earlwood University. For India, Smithtown University has the highest enrollment at over 7000 students, University of Riverview has around 5000 students, and Earlwood University has approximately 1000 students. For Nepal, Smithtown University has around 3000 students, University of Riverview has over 2000 students, and Earlwood University has just under 1000 students. For Vietnam, Smithtown University has just above 2000 students, University of Riverview has roughly 1500 students, and Earlwood University has around 500 students. For Indonesia, Smithtown University has almost 2000 students, University of Riverview has just over 1000 students, and Earlwood University has less than 500 students. For Colombia, Smithtown University has just below 1000 students, University of Riverview has just above 500 students, and Earlwood University has less than 200 students.
Given the complexity of the image, the above description may not be entirely accurate.
Note: Both the topic and the answer were created by one of our users.

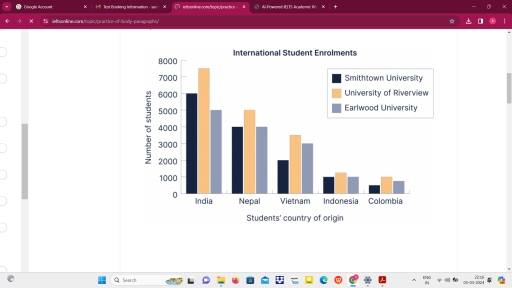
The bar chart illustrates the enrolments of international students from six different countries at Smithtown University, University of Riverview and Earlwood University. Overall, students from India were leading in enrolment while Colombia students were the least amount of registration for all universities. Furthermore, University of Riverview was the most popular university among the students for all countries.

Firstly for India, Riverview is leading university with approximately 7500 , followed closely by Smithtown University at 6000 while Earlwood University was the least number of student enrolment. Regarding Nepal and Indonesia , it is noticeable that Smithtown, 4000 and around 800 registration, represented equivently with Earlwood University , while Riverview contributed the highest number, contributing to 5000 and 1000 each for two different countries.

Next for Vietnam, Earlwood university interestingly gained to 3000 enrolment although Smithtown obivous dropping to 2000 students. Finally, concering Colombia, it is smiliar figures like Indonesia, Riverview University was also achieved the largest amount with 1000 exactly, following Earlwood, which is accounting for about 800 as a second largest and the rest univeristy with around 500.

Word Count: 178

Answers On The Same Topic:

The bar chart below shows the international student enrolments at three universities.

The bar chart illustrates the enrollments of international students from six different countries at Smithtown University, University of Riverview, and Earlwood University. Overall, students from India had the highest enrollment figures, while students from Colombia had the lowest number of registrations across all universities. Furthermore, the University of Riverview emerged as the most popular choice […]

The bar chart below shows the international student enrolments at three universities.

The provided bar graph displayed informant about the international student enrolment at three university and five different countries like India, Nepal, Vietnam, Indonesia, Colombia. Overall, it is clear that India had the highest number of international students while, Colombia had was the lowest number of student. additionally, the university of Riverview was the most popular […]

The bar chart below shows the international student enrolments at three universities.

The bar chart illustrates the number of international students from five different nations enrolled in three universities. Overall, the most noticiable feature is that Indian students were making up the largest proportion in admitted students among five nations. By contrast, Indonesian and Colombian students were on the lesser end, having the lowest number of pupils […]

The bar chart below shows the international student enrolments at three universities.

This chart shows amount of international students who registrated at 3 universities. In overall, India are the highest group of student who registry in 3 universities, while University of Riverview are the highest number of international students than other universities. India shows the biggest number of International Student in three universities, where more than 7000 […]

See All

Other Topics:

The chart below shows the spending by 18-20 year olds in one year country on five different products in 2010 and 2014.

The bar chart illustrates how much money 18-20-year olds people in one country spent to purchase five different products over a 4-year period between 2010 and 2014. Overall, it is clear that during the 4-year period demand for food, smartphones and toiletries increased. However, spending on books fell slowly, whereas expenditure on clothes remained unchanged. […]

The bar chart below shows the proportion of individuals possessing smartphones in five different countries from 2015 to 2020.

The bar chart compares the percentage of smartphone ownership in five countries in 2015 and 2020. Overall, all countries experienced an upward trend, whereas Country A remained at the top of the chart over the period. In addition, Country B was at the bottom all the time, while Country D experienced a meteoric rise and […]

The chart below shows the number of houses sold in 8 cities in the world for more than 5 Million US dollars in 2009 and 2014. Summarise the information by selecting and reporting the main features, and make comparisons where relevant.

The graph illustrates the amount of houses sold in different cities in the world for 5 milion us dollars between 2009 and 2014. Overall, more houses were sold by london than any other cities. Moreover, the proportions were doubled or tripled in every city in 2014. Many cities experienced rose solding houses. It can be […]

Bar chart shows the average hours per day in leisure and sports activities bu youngest and oldest populations in the US in 2015

The given bar chart delineates the average daily hours in leisure and sports activities by the youngest and oldest demographics in the US in 2015. Overall, spending time watching TV accounted for the highest amount of time in both age groups, while relaxing and thinking recorded the smallest in ages 15 to 19 and this […]

The number of storms that have passed through Da Nang city, Khanh Hoa province, Quang Ninh province, Ha Tinh province, Thanh Hoa province, Quang Binh province, Binh Dinh province, Nghe An province, Gia Lai province, and Dak Lak province over the past 70 years since 1945.

The bar chart provides a comparison of the number of storms recorded across ten specific provinces. Overall, it is clear that Tp. Đà Nẵng experienced the highest number of storms, while Đắk Lắk recorded the lowest figures. Generally, there is a clear downward trend in the data, with coastal regions tending to have a higher […]

The bar chart below shows the number of international students studying in four countries - Australia, the USA, the UK, and Canada - between 2000 and 2020

The given bar chart illustrates the amount of international students studying in Australia, the USA, the UK, and Canada from 2000 to 2010. Units are measured in percentages. Overall, it can clearly be seen that four of the countries experienced an upward trend. Although Germany was the most favourable country for international students, the rest […]

See All
We have detected unusual activity on your device.
Please verify your identity to continue.
Note: This verification step won't sign you in. If you have a premium account, please log in to access the service as usual.
Google/Gmail Verification
Or verify using Email/Code
We've sent a verification code to:
youremail@gmail.com (Not your email?)
Enter it below to complete the verification process.
Ensure your email address is correct, your inbox is not full, and you check your spam folder. If no email arrives, consider using an alternative email.
You will need a Premium plan to perform your action!
Note: If you already have a premium account, please log in to access our services as usual.

Plans & Pricing

Our mission is to make quality education accessible for everyone.
However, to keep our hardworking team running and this service alive, we genuinely need your support!
By opting for a premium plan, not only do you sustain us in achieving the mission, but you also unlock advanced features to enrich your learning experience.

Free

For learners who aren't pressed for time

What's included on Free
100+ Cambridge IELTS Tests
Instant IELTS Writing Task 1 & 2 Evaluation (2 times/month)
Instant IELTS Speaking Part 1, 2, & 3 Evaluation (5 times/month)
Instant IELTS Writing Task 1 & 2 Essay Generator (2 times/month)
500+ Dictation & Shadowing Exercises
100+ Pronunciation Exercises
Flashcards
Other Advanced Tools

Premium

For those serious about advancing their English proficiency, and for IELTS candidates aspiring to boost their band score by 1-2 points (especially in writing & speaking) in just 30 days or less

What's included on Premium
Save Your IELTS Test Progress
Unlock All Courses & IELTS Tests
Unlimited AI Conversations
Unlimited AI Writing Enhancement Exercises
Unlimited IELTS Writing Task 1 & 2 Evaluation
Unlimited IELTS Speaking Part 1, 2, & 3 Evaluation
Checked Answers Will Not Be Published
Unlimited IELTS Writing Task 1 & 2 Essay Generator
Unlimited IELTS Speaking Part 1, 2, & 3 Sample Generator
Unlimited Usage Of Advanced Tools
Priority Support within 24h (12-month plan only)

Due to the nature of our service and the provided free trials, payments are non-refundable.
Nếu bạn là người Việt Nam và không có hoặc không muốn trả bằng credit/debit cards, bạn có thể thanh toán bằng phương thức chuyển khoản:


Chọn gói:
419,000₫ 277,000 ₫ cho gói 1 tháng (chỉ 9,233₫/ngày)
1,239,000₫ 597,000 ₫ cho gói 3 tháng (chỉ 6,633₫/ngày)
2,469,000₫ 1,027,000 ₫ cho gói 6 tháng (chỉ 5,706₫/ngày)
4,929,000₫ 1,417,000 ₫ cho gói 12 tháng (chỉ 3,936₫/ngày)


Sau khi chuyển khoản, vui lòng đợi trình duyệt tự động điều hướng bạn trở lại Engnovate và bạn sẽ ngay lập tức nhận được mã kích hoạt tài khoản premium.
Nếu có lỗi xảy ra, bạn có thể liên hệ với team thông qua một trong các phương thức: email đến helloengnovate@gmail.com hoặc nhắn tin qua facebook.com/engnovate.
Vì toàn bộ công cụ trên website đều có thể sử dụng thử miễn phí, Engnovate không hỗ trợ hoàn tiền.