🔥 Today Only: Save 30% on Premium — Offer Ends Soon! - Upgrade Now!
Bar Chart

Band 6+: The bar chart below shows the number of people in further education by study mode and gender in three academic years. Summarise the information by selecting and reporting the main features, and make comparisons where relevant.

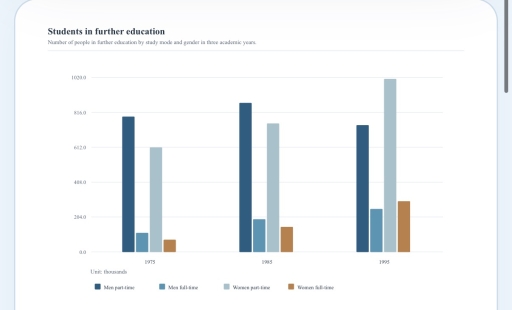
Image for topic: The bar chart below shows the number of people in further education by study mode and gender in three academic years. Summarise the information by selecting and reporting the main features, and make comparisons where relevant.
Our system will evaluate the answer based on this AI-generated description.
The image features a bar chart titled "Students in further education" with the subtitle "Number of people in further education by study mode and gender in three academic years." The vertical axis represents numbers in thousands, with gridlines labeled 0.0, 204.0, 408.0, 612.0, 816.0, and 1020.0, accompanied by the note "Unit: thousands". The horizontal axis displays three years: 1975, 1985, and 1995, each containing four categories defined by the legend: Men part-time, Men full-time, Women part-time, and Women full-time. In 1975, Men part-time is approximately 790 thousand, Men full-time is approximately 110 thousand, Women part-time is approximately 612 thousand, and Women full-time is approximately 70 thousand. In 1985, Men part-time is approximately 870 thousand, Men full-time is approximately 190 thousand, Women part-time is approximately 750 thousand, and Women full-time is approximately 140 thousand. In 1995, Men part-time is approximately 740 thousand, Men full-time is approximately 250 thousand, Women part-time is approximately 1010 thousand, and Women full-time is approximately 300 thousand.
Given the complexity of the image, the above description may not be entirely accurate.
Note: Both the topic and the answer were created by one of our users.

The bar chart illustrates the number of professionals in further education by study mode and gender in three academic years.

Overall, in all categories the number of students increased by 1995, while the highest number is shown by women’s part-time of approximately 1020 people in 1995.

In 1975, men part-time had a number of just above 816 people, followed by roughly 820 people in 1985, before declining to approximately 800 people in 1995. In contrast, men’s full-time was significantly lower in 1975, followed by about 100 people. Then it rose to just above 204 individuals in 1985 and reached a peak of approximately 210 professionals in 1995.

In comparison with men’s time, women’s part-time was 612 individuals in 1975. In 1985, the figure stood at about 800 people, before rising to 1020 professionals in 1995. Women’s full-time, on the other hand, showed the lowest number of roughly 100 in 1975. Then it increased by about 100 individuals in 1985. After all, the number reached a record of approximately 250 people in 1995.

Word Count: 172

Other Topics:

The bar chart illustrates data on the percentage of British adults of different age brackets using the Internet daily during two time periods: 2003 and 2006.

The provided bar chart illustrates the percentage of adults of different age groups who used the internet everyday from 2003-2006. Overall, the younger groups (16-24 years) showed the biggest consumption used the internet, whilts, the elder groups (>65 years) has the lowest presented using internet everyday. From 2003 to 2004, the percentage of using internet […]

The bar chart shows shares of expenditure for five major categories in the USA, Canada, the UK and Japan in 2009. Summarize the information by selecting and reporting the main features and make comparisons where relevant.

The bar chart illustrates the percentageof total expenditure allocated to fivedifferent categories (food, housing,transportation, healthcare and clothing) infour countries, namely the USA, Canada,the UK and Japan, in 2009. Overall, housing accounted for the largestproportion of expenditure in the USA,Canada and the UK, while food representedthe biggest share in Japan. In contrast,healthcare and clothing received the […]

The chart below shows the percentage of people who chose different kinds of transport to get to work in Melbourne and Sydney in 2006 and 2011.Summarise the information by selecting and reporting the main features, and make comparisons where relevant.

The given bar graph illustrates the percentage of individuals who chose various types of transport to get to work in melbourne and sydney in 2006 and 2011. Overall, a cursory glance at graph is enough to make it clear that private transport was more popular among people compared with public transport and cycling or walking. […]

The chart shows the end of year value for four major international money market indices in 2005, 2006, 2007, and 2008. [FTSE 100 = UK Market Index, Dow Jones = US Market Index, KOSPI = Korean Market Index, CAC 40 = French Market Index] Summarise the information by selecting and reporting the main features, and make comparisons where relevant.

The following chart illustrates the value for four main international money market in the end of the year. The infotmation provided from 2005 to 2008. Overall, it can be seen that Dow Jones has the biggest valume for all given period, while the lowest price has Korean market index. The UK and French market index […]

The chart below gives information about internet use by men and women in the UK in 2013. Summarise the information by selecting and reporting the main features, and make comparisons where relevant.

The bar graph compares internet use by males and females in the United Kingdom in 2013. From an overall perspective, it is apparent that women had a higher percentage in 2013. Of particular note, is Banking and online shopping were smaller percentages than other internet. Looking at the types of internet that grew, sending and […]

See All
We have detected unusual activity on your device.
Please verify your identity to continue.
Note: This verification step won't sign you in. If you have a premium account, please log in to access the service as usual.
Google/Gmail Verification
Or verify using Email/Code
We've sent a verification code to:
youremail@gmail.com (Not your email?)
Enter it below to complete the verification process.
Ensure your email address is correct, your inbox is not full, and you check your spam folder. If no email arrives, consider using an alternative email.
You will need a Premium plan to perform your action!
Note: If you already have a premium account, please log in to access our services as usual.

Plans & Pricing

Our mission is to make quality education accessible for everyone.
However, to keep our hardworking team running and this service alive, we genuinely need your support!
By opting for a premium plan, not only do you sustain us in achieving the mission, but you also unlock advanced features to enrich your learning experience.

Free

For learners who aren't pressed for time

What's included on Free
100+ Cambridge IELTS Tests
Instant IELTS Writing Task 1 & 2 Evaluation (2 times/month)
Instant IELTS Speaking Part 1, 2, & 3 Evaluation (2 times/month)
Instant IELTS Writing Task 1 & 2 Essay Generator (2 times/month)
500+ Dictation & Shadowing Exercises
100+ Pronunciation Exercises
Flashcards
Other Advanced Tools

Premium

For those serious about advancing their English proficiency, and for IELTS candidates aspiring to boost their band score by 1-2 points (especially in writing & speaking) in just 30 days or less

What's included on Premium
Save Your IELTS Test Progress & Analyze Mistakes By Question Type
Save Your Own Flashcard Sets & Use Them On Any Device
Unlock All Courses, IELTS Tests, Section & Part Practice
Unlimited AI Conversations
Unlimited AI Writing Enhancement Exercises
Unlimited IELTS Writing Task 1 & 2 Evaluation
Unlimited IELTS Speaking Part 1, 2, & 3 Evaluation
Checked Answers Will Not Be Published
Unlimited IELTS Writing Task 1 & 2 Essay Generator
Unlimited IELTS Speaking Part 1, 2, & 3 Sample Generator
Unlimited Usage Of Advanced Tools & AI Features
Priority Support within 24h (12-month plan only)

Due to the nature of our service and the provided free trials, payments are non-refundable.