🔥 Today Only: Save 30% on Premium — Offer Ends Soon! - Upgrade Now!
Bar Chart

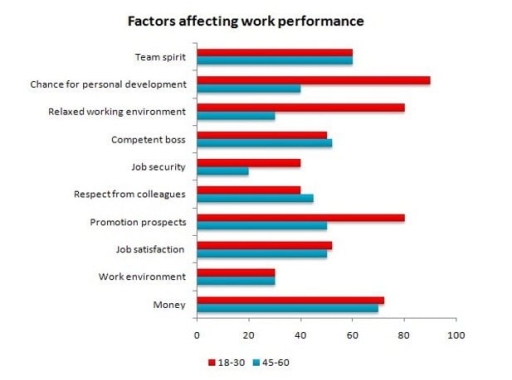
Band 6+: The bar chart below shows the results of a survey conducted by a personnel department at a major company. The survey was carried out on two groups of workers: those aged from 18-30 and those aged 45-60, and shows factors affecting their work performance.

Image for topic: The bar chart below shows the results of a survey conducted by a personnel department at a major company. The survey was carried out on two groups of workers: those aged from 18-30 and those aged 45-60, and shows factors affecting their work performance.
Our system will evaluate the answer based on this AI-generated description.
The image is a horizontal bar graph titled "Factors affecting work performance," with two age groups: 18-30 (dark blue) and 45-60 (light blue). For 18-30 age group, the percentages for each factor are as follows: Team spirit (100), Chance for personal development (80), Relaxed working environment (70), Competent boss (58), Job security (52), Respect from colleagues (50), Promotion prospects (45), Job satisfaction (40), Work environment (38), Money (30). For 45-60 age group, the percentages for each factor are: Team spirit (100), Chance for personal development (90), Relaxed working environment (82), Competent boss (60), Job security (55), Respect from colleagues (42), Promotion prospects (38), Job satisfaction (36), Work environment (32), Money (25). The scale at the bottom ranges from 0-100. Both age groups have the same top three factors in the same order, and both groups rate 'Money' the lowest.
Given the complexity of the image, the above description may not be entirely accurate.
Note: Both the topic and the answer were created by one of our users.

The given bar plot depicts factors which affect work performance depending on an age group.

It appears that on average the category of 45-60 years old paid less attention to work factors as almost within all parameters those who are 18-30 were dominant. Only such factors as ‘competent boss’ and ‘respect from colleagues’ were slightly of more importance for the second group than for the first one. ‘Team spirit’, ‘job satisfaction’, ‘work environment’ and ‘money’ had similar results. The parity or near that was achieved.

The younger group valued more such things as ‘chance for personal development’, ‘relaxed working environment’, ‘job security’, and ‘promotion prospects’. In those parameters they dominated by the factor of two or even more.

The chart demonstrated that people of different ages have different values with respect to the employment. Those who are younger pay more attention to personal growth, career opportunities and job conditions than their older colleagues.

Word Count: 153

Answers On The Same Topic:

The bar chart below shows the results of a survey conducted by a personnel department at a major company. The survey was carried out on two groups of workers: those aged from 18-30 and those aged 45-60, and shows factors affecting their work performance.

The bar chart presents the findings of a survey conducted by a personnel department, examining the factors that influence work performance among employees aged 18-30 and 45-60. Overall, team spirit was considered the most important factor by both groups. However, younger employees placed greater emphasis on personal development opportunities and a relaxed working atmosphere, whereas […]

The bar chart below shows the results of a survey conducted by a personnel department at a major company. The survey was carried out on two groups of workers: those aged from 18-30 and those aged 45-60, and shows factors affecting their work performance.

The bar chart presents the findings of a survey conducted by a personnel department, examining the factors that influence work performance among two age groups: employees aged 18-30 and those aged 45-60. Overall, team spirit was regarded as the most influential factor by both groups. However, younger employees placed greater emphasis on opportunities for personal […]

The bar chart below shows the results of a survey conducted by a personnel department at a major company. The survey was carried out on two groups of workers: those aged from 18-30 and those aged 45-60, and shows factors affecting their work performance.

The bar chart compares factors influencing work performance among employees aged 18-30 and 45-60, based on a survey conducted by a company’s personnel department. Overall, younger workers prioritized career growth elements, such as development opportunities and promotions, whereas older employees valued stability and interpersonal respect. Money was important to both groups, though more so for […]

The bar chart below shows the results of a survey conducted by a personnel department at a major company. The survey was carried out on two groups of workers: those aged from 18-30 and those aged 45-60, and shows factors affecting their work performance.

The bar chart compares factors influencing work performance among employees aged 18-30 and 45-60, based on a survey conducted by a company’s personnel department. Overall, younger workers prioritized career growth elements, such as development opportunities and promotions, whereas older employees valued stability and interpersonal respect. Money was important to both groups, though more so for […]

The bar chart below shows the results of a survey conducted by a personnel department at a major company. The survey was carried out on two groups of workers: those aged from 18-30 and those aged 45-60, and shows factors affecting their work performance.

The horizontal bar graph titled ‘Factors Affecting Work Performance’ illustrates the impact of various workplace elements on two distinct age demographics: individuals aged 18-30 years and those aged 45-60 years. A comparative analysis reveals consistent priorities between the two age groups, with both segments emphasizing the significance of team spirit, opportunities for personal development, and […]

See All

Other Topics:

The bar chart below shows figures of annual coffee and meat consumption.

The bar chart depicts the consumption of coffee and meat anually in 7 developed countries. It can be clearly seen from the chart that meat consumption is the highest among 7 countries, while coffee is the lowest. USA occupies the top rank of meat consumption by 122 kilograms per person. Furthermore, the consumption of meat […]

The graph shows the percentage of males aged 16-25 in a particular country who prefer watching sports to males who prefer participating in sports. Summarise the information by selecting and reporting the main features and make comparisons where relevant.

The diagram depicts the preferences of males aged 16-25 concerning viewing versus participating in various sports. It is evident that the proportion of males preferring watching is larger than that of spectators, whereas fishing stands out as a notable exception with the participation rate far surpassing the viewership. Another notable pattern is that football as […]

The graph below shows the sales of 5 types of items in four different seasons in a US department store in 2011.

The graph illustrates which kinds of goods were sold in winter, spring, summer, and autumn in a US department store in 2011. Units are measured in US dollars. Overall, the sales of women’s clothes were dominant throughout. While the figures for cosmetics and jewellery were relatively lower in winter and spring compared to those for […]

The graphs below show four categories of citrus fruits and the top three countries to which these were exported (in thousand tonnes) in 2012. Summarise the information by describing the main features of the charts and making comparisons where appropriate.

The charts demonstrate the four categories of citrus fruits – oranges, lemons, grapefruits, and other type and the top three countries to which these were exported in thousand tonnes in 2012. Overall, South Africa exported the greatest amount of oranges, while Turkey was the leading destination for lemons and grapefruits . In contrast , Mexico […]

The chart below shows the number of Asian elephants between 1997 and 2004.

The bar graph compares the number of elephants in Asian countries in two years-1997 and 2004. Overall, the number of India elephants was the highest throughout while the opposite was true for the figure for China elephants. The number of elephants in most Asian nations in 1997 was the higher than that in 2004 expect […]

The chart below shows the amount spent on six consumer goods in four European countries. Write a report for a university lecturer describing the information shown below. Spending in Thousand Pound Sterling.

The given chart reveals the amount of money spent on six types of consumer goods in each of the four countries. Overall, It is clear that British people spent significantly more money than people in the other three countries on all six goods. Of the six items, consumers spent the most money on photographic film. […]

See All
We have detected unusual activity on your device.
Please verify your identity to continue.
Note: This verification step won't sign you in. If you have a premium account, please log in to access the service as usual.
Google/Gmail Verification
Or verify using Email/Code
We've sent a verification code to:
youremail@gmail.com (Not your email?)
Enter it below to complete the verification process.
Ensure your email address is correct, your inbox is not full, and you check your spam folder. If no email arrives, consider using an alternative email.
You will need a Premium plan to perform your action!
Note: If you already have a premium account, please log in to access our services as usual.

Plans & Pricing

Our mission is to make quality education accessible for everyone.
However, to keep our hardworking team running and this service alive, we genuinely need your support!
By opting for a premium plan, not only do you sustain us in achieving the mission, but you also unlock advanced features to enrich your learning experience.

Free

For learners who aren't pressed for time

What's included on Free
100+ Cambridge IELTS Tests
Instant IELTS Writing Task 1 & 2 Evaluation (2 times/month)
Instant IELTS Speaking Part 1, 2, & 3 Evaluation (2 times/month)
Instant IELTS Writing Task 1 & 2 Essay Generator (2 times/month)
500+ Dictation & Shadowing Exercises
100+ Pronunciation Exercises
Flashcards
Other Advanced Tools

Premium

For those serious about advancing their English proficiency, and for IELTS candidates aspiring to boost their band score by 1-2 points (especially in writing & speaking) in just 30 days or less

What's included on Premium
Save Your IELTS Test Progress & Analyze Mistakes By Question Type
Save Your Own Flashcard Sets & Use Them On Any Device
Unlock All Courses, IELTS Tests, Section & Part Practice
Unlimited AI Conversations
Unlimited AI Writing Enhancement Exercises
Unlimited IELTS Writing Task 1 & 2 Evaluation
Unlimited IELTS Speaking Part 1, 2, & 3 Evaluation
Checked Answers Will Not Be Published
Unlimited IELTS Writing Task 1 & 2 Essay Generator
Unlimited IELTS Speaking Part 1, 2, & 3 Sample Generator
Unlimited Usage Of Advanced Tools & AI Features
Priority Support within 24h (12-month plan only)

Due to the nature of our service and the provided free trials, payments are non-refundable.