Our system will evaluate the answer based on this AI-generated description.
The image is a horizontal bar graph titled "Factors affecting work performance," with two age groups: 18-30 (dark blue) and 45-60 (light blue). For 18-30 age group, the percentages for each factor are as follows: Team spirit (100), Chance for personal development (80), Relaxed working environment (70), Competent boss (58), Job security (52), Respect from colleagues (50), Promotion prospects (45), Job satisfaction (40), Work environment (38), Money (30). For 45-60 age group, the percentages for each factor are: Team spirit (100), Chance for personal development (90), Relaxed working environment (82), Competent boss (60), Job security (55), Respect from colleagues (42), Promotion prospects (38), Job satisfaction (36), Work environment (32), Money (25). The scale at the bottom ranges from 0-100. Both age groups have the same top three factors in the same order, and both groups rate 'Money' the lowest.
Given the complexity of the image, the above description may not be entirely accurate.
Skyrocket your IELTS band score by 1-2 points in under a month with our premium plan!
Note: Both the topic and the answer were created by one of our users.
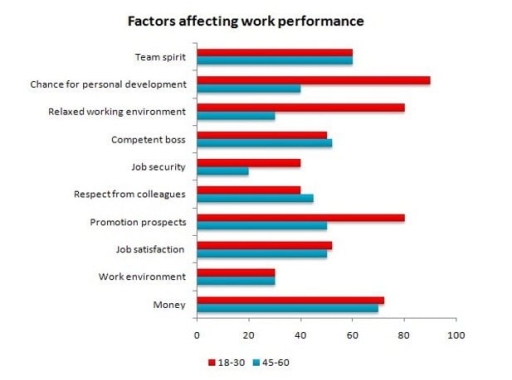
The bar chart compares factors influencing work performance among employees aged 18-30 and 45-60, based on a survey conducted by a company’s personnel department.
Overall, younger workers prioritized career growth elements, such as development opportunities and promotions, whereas older employees valued stability and interpersonal respect. Money was important to both groups, though more so for younger staff.
For the 18-30 age groups, personal development and promotion prospects were the top motivators, both exceeding 80%. Team spirit, a competent boss, job satisfaction, and money were are also important, with figures ranging from 50-70%. The relaxed working environment attracted around 80% of younger workers, whereas job security and respect from colleagues were less valued, both under 40%. Conversely, workers aged 45-60 placed greater emphasis on money, with slightly above 60% rating it crucial. Promotion prospects followed at around 50%, while personal development stood close to 40%. Respect from colleagues was just over 40%, and a relaxed working environment slightly below this figure. Job security was the least valued, at about 20-25%.
Word Count: 169