Our system will evaluate the answer based on this AI-generated description.
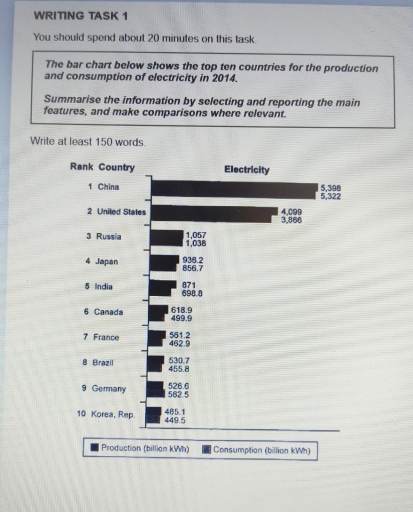
The image displays a bar chart with two sets of bars for each of the top ten countries, one representing production and the other consumption of electricity in 2014, with production in the first bar and consumption in the second for each pair. Production and consumption are measured in billion kWh. China ranks first with production at 5,398 and consumption at 5,322, followed by the United States with production at 4,099 and consumption at 3,866. Russia is third with production at 1,057 and consumption at 1,038. Japan's production is 936.2 and consumption is 857.6, coming in fourth. India, in fifth place, shows production at 871 and consumption at 698.8. Canada has a production of 619.9 and consumption at 518, taking the sixth spot. Seventh-ranked France shows production at 529.9 and consumption at 462.9. Brazil, in eighth place, has production at 530.7 and consumption at 455.8. Germany, ranking ninth, shows production at 526.6 and consumption at 582.5. The tenth-ranked Korea, Rep. has production at 485.1 and consumption at 449.5. There is a key at the bottom indicating production with a full bar and consumption with a striped bar.
Given the complexity of the image, the above description may not be entirely accurate.
Skyrocket your IELTS band score by 1-2 points in under a month with our premium plan!
Note: Both the topic and the answer were created by one of our users.
The bar chart compares the best 10 countries for the production and using of electricity in 2014.
It is clear that China was the world’s most popular country for the production electricity in 2014. However, the USA saw a rise of large of prodaction, but fewer than China.
In that year, China’s prodaction and consamption statistic shown almost similar indicators also with other countries. In China prodaction was about 5,398 billion, consumption 5,322 billion. While United State’s statistic was 4,009 billion of prodaction, 3,866 ,billion of concumption. Other countries like: Russia, Japan, India, Canada, Franch, Brazill, Germany, Korea each producted and had concumption under 1000 billion, They all have similiar indicators.
Brazill and Germany had very similiar indicators, Brazill’s production 530.7 billion. Germany’s production 526,6 billion. But, they also had some differences, in Brazill lower statistic of consumption than Germany’s. There 455,8 billion, in Germany saw a rise 582,5 billion of consumption.
Word Count: 152
