Our system will evaluate the answer based on this AI-generated description.
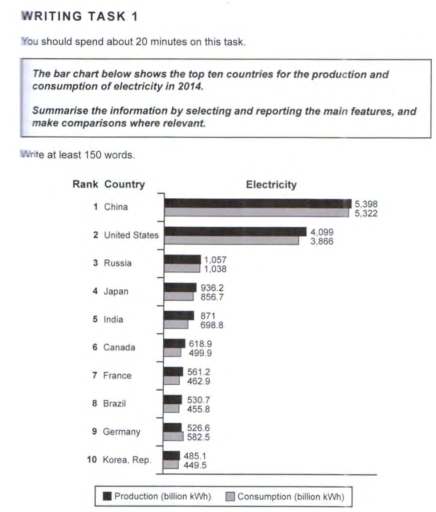
The image presents a bar chart with the top ten countries for production and consumption of electricity in 2014, ranking from 1 to 10. The chart has two different types of bars representing production (billion kWh) and consumption (billion kWh) for each country. For China, production is at 5,398 and consumption is at 5,322. For the United States, production is at 4,089 and consumption is at 3,866. Russia's production is at 1,057 and consumption is at 1,038. Japan has a production of 936.2 and a consumption of 856.7. India's production is at 871 and consumption is at 818.8. Canada has a production of 618.9 and consumption of 499.9. France's production is at 562.2 and consumption is at 461.9. Brazil has a production of 530.7 and consumption of 455.8. Germany's production is at 526.6 and consumption is at 582.5. Lastly, the Republic of Korea has a production of 485.1 and consumption of 449.5.
Given the complexity of the image, the above description may not be entirely accurate.
Skyrocket your IELTS band score by 1-2 points in under a month with our premium plan!
Note: Both the topic and the answer were created by one of our users.
The bar chart illustrate the top ten countries for the production and utilization of electricity in 2014.
Overall, the given data shows the manufacture and consumption of electricity by the top for nations. This bar graph display that the manufacturing of the electricity is higher than the consumption in top ten countries. Ching and United states are the powerhouse of the Electricity.
In the year 2014, All the top nation are producing and utilizing the electricity in billions kWh. China produced 5398 billion kwh of electricity and had consumed 5322 billion kwh which was the highest in both criteria amongst all the countries under comparison. They were closely followed by the USA, which managed to generate 4099 billion kwh while consuming 3866 kwh. We The data point that electricity consumption in 9 out of 10 to one countries is always high country, which is & Germany. high compared Therefore, it can be concluded that the power generation of most developed cations. to be more or states always tends than their total amount of usages.
Word Count: 174