Our system will evaluate the answer based on this AI-generated description.
The image presents a bar chart delineating the variability in venue preferences among different demographic segments of people residing in Canada, segmented into "New migrants born in other countries," "New migrants born in English-speaking countries," and "Born in Canada." Cinemas were frequented by 50% of new migrants from other countries, 60% of those from English-speaking nations, and 70% of Canadian-born individuals. Theatre attendance was lowest among the categories: 10% for both new migrants from English-speaking countries and those born in other countries, while 25% of the Canadian-born population attended. Libraries showed participation rates of 40% for new migrants from other countries, 35% for English-speaking new migrants, and 60% for natives. Visits to the zoo included 50% of new migrants from other countries, 35% from English-speaking countries, and a notably small 20% of Canadian-born individuals.
Given the complexity of the image, the above description may not be entirely accurate.
Skyrocket your IELTS band score by 1-2 points in under a month with our premium plan!
Note: Both the topic and the answer were created by one of our users.
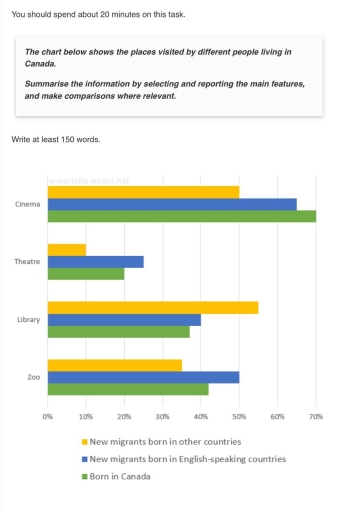
The given chart illustrates the places that are visited by three certain groups of people living in Canada, including native Canadians, migrants from English-speaking countries and migrants from other countries across the globe.
Overall, it can be seen that cinemas are the most popular among all groups, whilst libraries are the least visited. People born in Canada generally visit places more regularly than new migrants.
Looking specifically at cinema, cinema is a popular choice among native Canadians, accounted for the highest percentage, with attendance rates exceeding hefty 70. This figure is slightly lower for migrants from English-speaking countries, making up around 65%, and the lowest for those born in other countries, comprising roughly 50%. Similarly, a noticeable pattern can be observed in amusement parks, where around half of the original Canadian visit them, compared to about 45% of migrants who come from English-speaking countries and solely approximately 35% of other migrants. In terms of library goers, this category shows the lowest figures, with all groups staying just below 30%, especially migrants born in other countries.
Word Count: 175