Our system will evaluate the answer based on this AI-generated description.
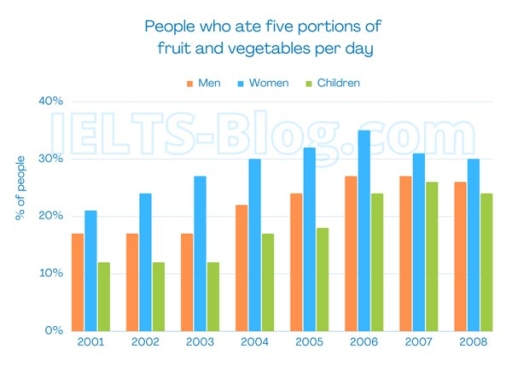
The image shows a bar chart titled "People who ate five portions of fruit and vegetables per day" with three categories: Men, Women, and Children, represented over the years 2001 to 2008. The percentage of men who ate five portions ranged from just over 20% in 2001, dipping to just below 20% in 2002, rising to about 25% in 2003, falling slightly in 2004, then increasing steadily to just over 25% in 2005, just under 30% in 2006, just over 30% in 2007, and reaching almost 35% in 2008. The percentage of women was consistently the highest, starting at just under 30% in 2001, rising to just over 30% in 2002, increasing sharply to nearly 35% in 2003, dropping slightly in 2004, then jumping to almost 40% in 2005, falling back to just over 35% in 2006, rising to nearly 40% again in 2007, and reaching 40% in 2008. The percentage of children eating five portions started at just over 10% in 2001, increased to about 15% in 2002, remained stable in 2003, rose to just over 20% in 2004, dropped back to just under 20% in 2005, increased to about 25% in 2006, remained stable in 2007, and rose to just under 30% in 2008.
Given the complexity of the image, the above description may not be entirely accurate.
Skyrocket your IELTS band score by 1-2 points in under a month with our premium plan!
Note: Both the topic and the answer were created by one of our users.
Contained in the given bar chart is data pertaining to the proportion of the UK’s population who consumed five portions of vegetables and fruits daily between 2001 and 2008.
Overall, the percentages of all three types of consumers experienced upward trends throughout the given period. Additionally, female consumers’ figure was always the highest, while the converse was true for children’s one.
In 2001, consumption of men, women and children on five adequate fruits and vegetables meals comprised of approximately 17%, a fifth and about 10%, in that order. In the following two years, both men’s and children’s figures remained stable. While for women, that percentage rose to more than a half of children’s one and just above a quarter, in 2002 and 2003, respectively. Then, all the statistics saw a gradual increase of 4% to 5% in 2005.
From 2005 onward, females who consumed the studied diets reached a peak of just under a third before declining moderately to about 29% in 2008. Meanwhile, the men’s figure reached a plateau in 2007 after increasing negligibility to 25% in 2006 and ended up at just under 24% in 2008. Furthermore, children constituted 23% of total consumers in 2006 which was 5% higher than that in 2005 before fluctuating to the same percentage in 2008 which was at approximately 23%.
Word Count: 218
