Our system will evaluate the answer based on this AI-generated description.
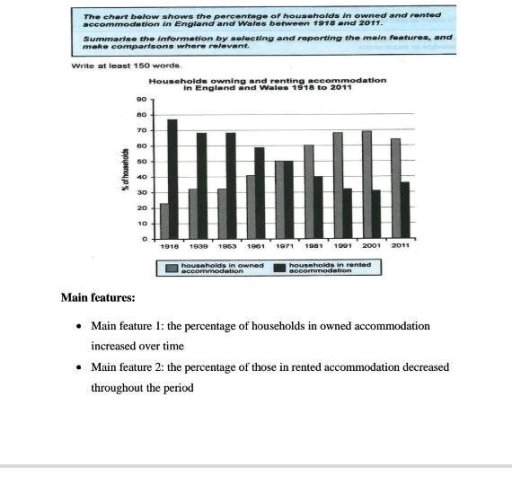
The image shows a bar graph with two types of data - households in owned accommodation and households in rented accommodation in England and Wales from the years 1918 to 2011. Households in owned accommodation in 1918 have a percentage of approximately 23, which increases to approximately 31 in 1939, approximately 32 in 1953, approximately 42 in 1961, approximately 51 in 1971, approximately 57 in 1981, approximately 68 in 1991, approximately 69 in 2001, and approximately 64 in 2011. Households in rented accommodation in 1918 have a percentage of approximately 77, which decreases to approximately 69 in 1939, approximately 68 in 1953, approximately 58 in 1961, approximately 49 in 1971, approximately 43 in 1981, approximately 32 in 1991, approximately 31 in 2001, and approximately 36 in 2011. The bar graph demonstrates two main features: 1) an increase in the percentage of households in owned accommodation and 2) a decrease in the percentage of households in rented accommodation over the period from 1918 to 2011.
Given the complexity of the image, the above description may not be entirely accurate.
Skyrocket your IELTS band score by 1-2 points in under a month with our premium plan!
Note: Both the topic and the answer were created by one of our users.
The bar graph illustrates the proportion of English and Welsh house owners and tenants from 1918 to 2011.
Overall, the popularity of owned residence gradually increased among households throughout the years while the renting accommodation side experienced a steady drop over the same time.
In 1918, owning an accommodation was not people’s first choice since only around 25% of the society in England and Wales possessed a house, but the situation changed slowly and the percentage rose to nearly 70% by the year 2001 with having a short pause between the years 1939 and 1953. then there was a small fall, dropping to approximately 65%, in 2011.
On the other hand, the number of rented residences was at its peak in 1918 with almost 75% of the households. However, it went down by around 10% in the year 1939 and after staying stable for 14 years, the downfall continued where it dropped to a bit more than 30% in 2001 with a minor growth to reach 35% by the year 2011.
Word Count: 171
