🔥 Today Only: Save 30% on Premium — Offer Ends Soon! - Upgrade Now!
Bar Chart

Band 8+: the bart chart below shows the top ten countries for the production and

Image for topic: the bart chart below shows the top ten countries for the production and
Our system will evaluate the answer based on this AI-generated description.
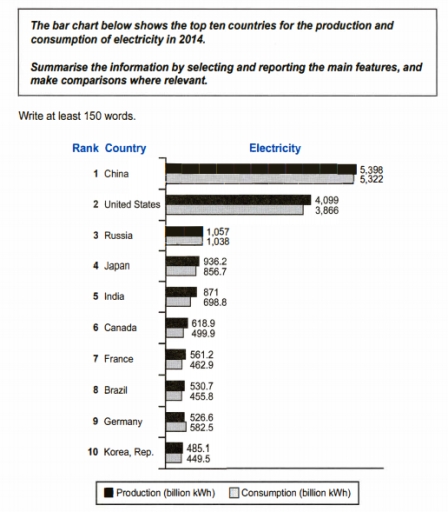
The image displays a bar chart detailing the 2014 electricity production and consumption for the top ten countries. China ranks 1st with production at 5,398 billion kWh and consumption at 5,322 billion kWh. The United States follows, producing 4,099 billion kWh and consuming 3,866 billion kWh. Russia is 3rd, with production at 1,057 billion kWh and consumption at 1,038 billion kWh. Japan's production is 936.2 billion kWh and consumption 856.7 billion kWh. India shows 871 billion kWh produced and 698.8 billion kWh consumed. Canada ranks 6th, producing 618.9 billion kWh, consuming 499.9 billion kWh. France produces 561.2 billion kWh and consumes 462.9 billion kWh. Brazil produces 530.7 billion kWh and consumes 455.8 billion kWh. Germany shows production at 526.6 billion kWh with consumption at 582.5 billion kWh. Lastly, Korea, Rep. has production at 485.1 billion kWh and consumption at 449.5 billion kWh.
Given the complexity of the image, the above description may not be entirely accurate.
Note: Both the topic and the answer were created by one of our users.

The chart compares leading ten different nations in terms of producing and consuming electricity in 2014. Overall, China had the largest share of energy production and consumption, followed by the United States. Additionally, in this year, almost all countries produced more electrical power than they consumed, except for Germany.

In China, the amount of energy that was used and produced was highest in this category at 5,398 and 5,322 billion kWh, respectively. Following China, the United States generated 4,099 billion kWh of energy, which was slightly higher than its usage, at 3,866 billion kWh.

Regarding other nations such as Russia, Japan, and India, they showed noticeable figures, while the amount of energy used and generated was almost the same, at around 900 billion kWh. As for Canada, France, Brazil, and the Republic of Korea, their energy production exceeded consumption, with the lowest figures in this group being around 500 billion kWh. However, despite being near the bottom of the table, Germany was the only country where energy consumption surpassed production, with figures of 582.5 billion kWh and 526.6 billion kWh, respectively.

Word Count: 181

Answers On The Same Topic:

the bart chart below shows the top ten countries for the production and

The bar chart compares ten different countris in terms of they used electricity for production and consumption during year– 2014. Overall, China country topped the chart as the major users electricity country across year.Meanwhile, not only was Korea and Rep country conspicuous for its lowest rank, but it was also the only country which saw […]

the bart chart below shows the top ten countries for the production and

The given bar chart illustrates the ranking between diferent countries about the generation and consumption of electricity in 2014. It is clear that China got the highest number in both the consumtion and production. While the figure for production usually showed higher than than the consumtion, Germany was the only reception. In 2014, China led […]

the bart chart below shows the top ten countries for the production and

The bar chart show us about the summary of top ten countries for the production and consumption of electricity in 2014. Research has found that China ranked the first place for the production and consumption of electricity in 2014, they consume electricity up to 5,322 billion kWh and 5,398 billion kWh for production. They known […]

the bart chart below shows the top ten countries for the production and

The given bar chart illustrates information about production and consumption of electricity in 2014 , among the ten different countries. It is clearly seen that China leader of production and consumption of electricity with the most demanding results. Then, comes The United States with 4,099 (billion kWh) of manufacturing, and 3,866 (billion kWh) of usage. […]

the bart chart below shows the top ten countries for the production and

The bar graph displays the top ten electricity producing and consuming nations in 2014. In overview, China stood at the top having both the highest consumption and production of electricity, whereas Korea was at the last among 10 countries presented. Additionally, Germany was the only nation to produce less electricity than it consumed during 2014. […]

See All

Other Topics:

The charts show the percentage of income spent on food and other goods in 3 European countries from 1998 – 2008.

The graph illustrates how much many spent on food and other merchandise in three European countries between 1998 and 2008. Overall, expenditure in all three countries increased in both categories over the ten-year period. In addition, France and England experienced the most significant increases in spending on other goods, while spending on food also grew […]

The chart gives information on the percentage of women going into higher education in five countries for the years 1980 and 2015.

The given chart illustrates the figure for young women taking to further education comparing 5 nations in the period from 1980 to 2015. Overall, the proportion of student girls entering higher education increased significantly with the UK, USA, South Korea, and France. Additionally, Australia recorded the highest rate, which remained unchanged over a 35-year period. […]

The graph below represents the number of books borrowed from the library in three different categories (fiction, non-fiction, and children's books) over a period of half a year. Write a summary of the information, highlighting the key features, and making comparisons where relevant.

The bar chart compare the number of fiction, non fiction, and children’s book borrowed from libraty between january and june Overall, the figures of fiction and non fiction books significantly decreased, while the number of children’s book slightly increased. Despite, the substansial changes the number of fiction books remained the highest, whereas the number of […]

The charts below show the main sources of funding for wildlife conservation in Africa and South America for the years 2010 and 2020. Summarise the information by selecting and reporting the main features, and make comparisons where relevant.

The charts depict information about the core sources of funding for wildlife conservation in Africa and South Africa from 2010 to 2020. Overall, in Africa, tourism revenue played a vital role among other funding sources, meanwhile in South America, government grants took control throughout the years. In 2010, government grants in Africa were 120$ million, […]

The bar chart shows the average duration of housework women did when compared to men who had full-time work in the UK between 1985 and 2005

The given bar graph illustrates the average time of homework comparison with women and men who had full time work in the UK from 1985 to 2005. Overall, it is clearly see that from the graph, unemployed women spent their maximum time on housework rather than any other category and men with full time employment […]

The bar chart below shows the number of cars sold by three different car manufacturers (Toyota, Ford, and Honda) in four different regions (North America, Europe, Asia, and South America) in 2023. Summarize the information by selecting and reporting the main features and make comparisons where relevant.

The given bar chart illustrates number of car sales by three different manufacturers (Toyota, Ford and Honda) in 2023, across four different regions: North America, Europe, Asia and South America. Overall, North America has the highest number of sales while while South America has the lowest in all three categories. Toyota cars has the most […]

See All
We have detected unusual activity on your device.
Please verify your identity to continue.
Note: This verification step won't sign you in. If you have a premium account, please log in to access the service as usual.
Google/Gmail Verification
Or verify using Email/Code
We've sent a verification code to:
youremail@gmail.com (Not your email?)
Enter it below to complete the verification process.
Ensure your email address is correct, your inbox is not full, and you check your spam folder. If no email arrives, consider using an alternative email.
You will need a Premium plan to perform your action!
Note: If you already have a premium account, please log in to access our services as usual.

Plans & Pricing

Our mission is to make quality education accessible for everyone.
However, to keep our hardworking team running and this service alive, we genuinely need your support!
By opting for a premium plan, not only do you sustain us in achieving the mission, but you also unlock advanced features to enrich your learning experience.

Free

For learners who aren't pressed for time

What's included on Free
100+ Cambridge IELTS Tests
Instant IELTS Writing Task 1 & 2 Evaluation (2 times/month)
Instant IELTS Speaking Part 1, 2, & 3 Evaluation (2 times/month)
Instant IELTS Writing Task 1 & 2 Essay Generator (2 times/month)
500+ Dictation & Shadowing Exercises
100+ Pronunciation Exercises
Flashcards
Other Advanced Tools

Premium

For those serious about advancing their English proficiency, and for IELTS candidates aspiring to boost their band score by 1-2 points (especially in writing & speaking) in just 30 days or less

What's included on Premium
Save Your IELTS Test Progress & Analyze Mistakes By Question Type
Save Your Own Flashcard Sets & Use Them On Any Device
Unlock All Courses, IELTS Tests, Section & Part Practice
Unlimited AI Conversations
Unlimited AI Writing Enhancement Exercises
Unlimited IELTS Writing Task 1 & 2 Evaluation
Unlimited IELTS Speaking Part 1, 2, & 3 Evaluation
Checked Answers Will Not Be Published
Unlimited IELTS Writing Task 1 & 2 Essay Generator
Unlimited IELTS Speaking Part 1, 2, & 3 Sample Generator
Unlimited Usage Of Advanced Tools & AI Features
Priority Support within 24h (12-month plan only)

Due to the nature of our service and the provided free trials, payments are non-refundable.
Nếu bạn là người Việt Nam và không có hoặc không muốn trả bằng credit/debit cards, bạn có thể thanh toán bằng phương thức chuyển khoản:


Chọn gói:
419,000₫ 277,000 ₫ cho gói 1 tháng (chỉ 9,233₫/ngày)
1,239,000₫ 597,000 ₫ cho gói 3 tháng (chỉ 6,633₫/ngày)
2,469,000₫ 1,027,000 ₫ cho gói 6 tháng (chỉ 5,706₫/ngày)
4,929,000₫ 1,417,000 ₫ cho gói 12 tháng (chỉ 3,936₫/ngày)


Sau khi chuyển khoản, vui lòng đợi trình duyệt tự động điều hướng bạn trở lại Engnovate và bạn sẽ ngay lập tức nhận được mã kích hoạt tài khoản premium.
Nếu có lỗi xảy ra, bạn có thể liên hệ với team thông qua một trong các phương thức: email đến helloengnovate@gmail.com hoặc nhắn tin qua facebook.com/engnovate.
Vì toàn bộ công cụ trên website đều có thể sử dụng thử miễn phí, Engnovate không hỗ trợ hoàn tiền.