Our system will evaluate the answer based on this AI-generated description.
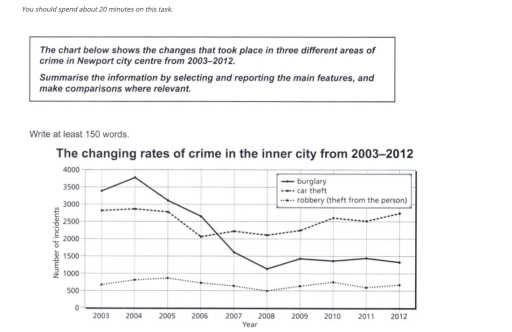
The image displays numerical data on crime rates in Newport city center from 2003-2012, detailing occurrences for burglary, car theft, and robbery (theft from the person). In 2003: burglary at 3400, car theft at 2800, robbery at 600. In 2004: burglary slightly decreased to 3600, car theft remained at 2800, robbery rose to 800. In 2005: burglary continued decreasing to 3100, car theft at 2600, robbery stayed at 800. In 2006: burglary dropped further to 2800, car theft at 2300, robbery at 800. In 2007: burglary decreased to 2100, car theft at 2100, robbery decreased to 700. In 2008: burglary at 1600, car theft at 2000, robbery slightly increased to 700. In 2009: burglary rose to 1800, car theft at 1900, robbery steady at 700. In 2010: burglary slightly increased to 1800, car theft decreased to 1700, robbery remained at 900. In 2011: burglary decreased to 1400, car theft remained stable at 1700, robbery increased to 1100. In 2012: burglary reduced to 1100, car theft kept at 1800, robbery at peak 1200.
Given the complexity of the image, the above description may not be entirely accurate.
Skyrocket your IELTS band score by 1-2 points in under a month with our premium plan!
Note: Both the topic and the answer were created by one of our users.
The chart reports the crime situation in Newport city centre from 2003 to 2012.
The chart divides the type of crime into burglary, car theft and robbery. From the graph it can be demonstrated that burglary is the one with the highest peak at 3750, which had been reached in 2004 , compared with the other ones. Robbery is the crime less diffuses in the survey, which had reached a trough at 500 in 2008. Car theft and burglary curves shared a similar path, there had been an increase from 2003 to 2004, a subsequent decrease in 2006. Starting from 2006 to 2012 both areas have experienced a steady change. Burglary is the area that had experienced more fluctuation in the survey, in fact from 2004 to 2008, the curve became downward sloping and steeper. The lasts four years are pretty similar for all the three curves, they had reported a moderate change.
Overall, the survey shows that the rate of crime in Newport city had experienced different trend from 2003 to 2012, with an initial decreasing, and a following slight change inside a a small interval.
Word Count: 187
