Our system will evaluate the answer based on this AI-generated description.
The image displays a line chart on computer ownership in the US from 1997 to 2012: No computer ownership started at 60% in 1997, declining to about 45% in 2000, further decreasing to just over 30% in 2003, dropping to roughly 25% in 2006, falling beneath 20% in 2009, and reaching around 10% in 2012. Ownership of 1 computer started at 25% in 1997, increased to near 40% in 2000, peaking above 50% in 2003, then dropping back to around 40% in 2006, stabilizing around 35% in 2009, and slightly decreasing to just under 30% in 2012. Ownership of 2 computers began at 10% in 1997, rose to about 15% in 2000, continued increasing to near 20% in 2003, maintained a similar level in 2006, rose slightly again in 2009, and peaked just below 30% in 2012. Ownership of 3 or more computers started at below 10% in 1997, minimally increased in 2000, gradually rose to about 10% in 2003, increased marginally to around 15% in 2006, rose to just below 20% in 2009, and further increased to approximately 25% in 2012.
Given the complexity of the image, the above description may not be entirely accurate.
Skyrocket your IELTS band score by 1-2 points in under a month with our premium plan!
Note: Both the topic and the answer were created by one of our users.
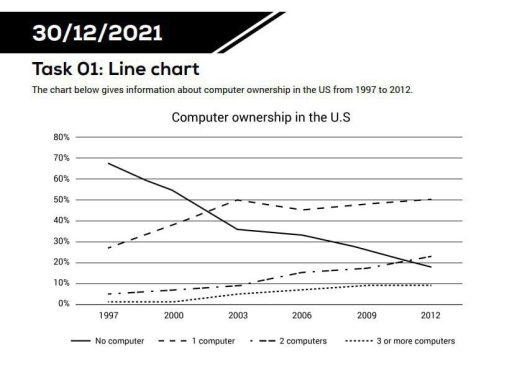
The provided line graph illustrates to us the information about computer ownership in the US with timeline 1997 to 2012. Overall, People without any computers are falling steadily. However, the percentage of human, who has 1, 2, 3 or more had been rising for 15 years.
The first part of line graph provides declining majority amount of human, who does not use computers, laptops, and etc. In 1997 it was appromoxiately 70%, in 2003 it was 25%, but at the end in 2012 it is only 20%. Sustainable drop was between 2000 and 2003.
On the other hand, minority with only computer owners growth rapidly for all years, except with only computer owners between 2003 and 2006. Similirly, people with 2 and 3 or more computers percentage show surge for all 15 years between 1997 to 2012. The majority of people had been spending their moneys for all 15 years.
Word Count: 150