🔥 Today Only: Save 30% on Premium — Offer Ends Soon! - Upgrade Now!
Bar Chart

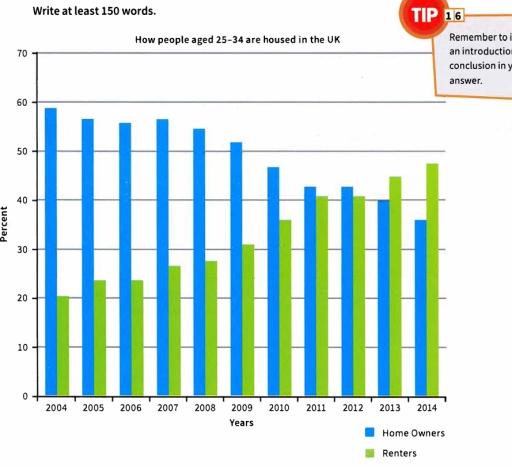
Band 4+: The chart below gives information about how people aged 25-34 are housed in the UK.

Image for topic: The chart below gives information about how people aged 25-34 are housed in the UK.
Our system will evaluate the answer based on this AI-generated description.
The image depicts a bar graph titled "How people aged 25-34 are housed in the UK" representing the years 2004 to 2014. The vertical axis shows percentage, ranging from 0 to 70 in increments of 10. The horizontal axis lists the years incrementally. Each year has two bars representing "Home Owners" and "Renters". In 2004, Home Owners are approximately 60% and Renters 40%. 2005 shows Home Owners around 58% and Renters 42%. 2006 has Home Owners at roughly 56% and Renters 44%. In 2007, Home Owners are about 54% and Renters 46%. 2008 displays Home Owners at 52% and Renters 48%. For 2009, Home Owners are approximately 50% and Renters 50%. 2010 shows Home Owners around 48% and Renters 52%. 2011 has Home Owners at roughly 46% and Renters 54%. In 2012, Home Owners are about 44% and Renters 56%. 2013 displays Home Owners at 42% and Renters 58%. For 2014, Home Owners are approximately 40% and Renters 60%.
Given the complexity of the image, the above description may not be entirely accurate.
Note: Both the topic and the answer were created by one of our users.

The line chart illustrates how many people aged 25 to 34 owned and rented house in the UK between 2004 and 2014.

Overall, it is clear that the percentage of renters increased while the figure for home owners decreased in the UK during the 11 years period. It is also obvious the proportion of the home owners was highest.

The period between 2004 and 2009 saw a steady fluctuation in owned house and a moderate rise in rented house. The number of home owners was highest in 2004, about 59%. The figure of renters was lower than owned house by 3 times about 20%. In 2009, the percentage of home owners decreased from 58% to over 50%. In contrast, there was a steady growth from 20% to over 30%.

From 2009 to 2014, the proportion of owned house also declined gradually between over 50% and under 40%.

Word Count: 147

Answers On The Same Topic:

The chart below gives information about how people aged 25-34 are housed in the UK.

The bar charts illustrate the percentage of people age from 25 to 34 stay at thier home or renters in the UK. Overall, the propotion of idividuals choose to rent has been increased all of time but sometimes fell down a little bit. By contrast, acounted for people who owners house decrease by the time. […]

The chart below gives information about how people aged 25-34 are housed in the UK.

The bar chart shows how people ages 25-34 are housed in the UK. We can see green and blue bars, which illustrates renters and home owners. The home ownership has decreased gradually since 2004 to 2014 year and number of house tenants has increased since 2004 to 2014 years. The blue bars shows home owners, […]

The chart below gives information about how people aged 25-34 are housed in the UK.

The chart above illustrates the percentage of 25-34 aged person who are housed from 2004 to 2014 in UK. Overall, buying of home was more preferred than renting, however a slightly decreasing was seen. In contrast, amount of renters were increasing. In 2004 buying a home reached its peak; nearly 58 percentage of person in […]

The chart below gives information about how people aged 25-34 are housed in the UK.

The bar graph illustrates how people at the age of 25-35 are accommodated in the uk . Over the whole time period, number of homeowners were higher than renters but situation changed over time In 2004-2006 the number of homeowners in the UK was approximately 60 ,before it started decreasing to almost 50 in 2007-2010, […]

The chart below gives information about how people aged 25-34 are housed in the UK.

The data presents the residents aged between 25 to 34 who lived in UK. Firstly, In 2004 the citizens of UK and proportion of own home owners were on peak 59%. Furthermore, between the year 2004 to 2011 the percentage of home owners were highest like 42% to 59%.However,the amount of own home owners were […]

See All

Other Topics:

The chart below shows the percentage of children in a European country who took part in four kinds of activities in 2009

The bar graph illustrates the proportion of youths across three age groups participating in four different kinds of activities: watching tv, reading comics, playing video games, and riding bikes in 2009. In overview, watching television was the most popular activity across all age groups, whereas playing video games was recorded as the lowest overall percentage, […]

The chart shows the percentage of households having different goods in a country in Europe in 2004 and 2008

The line chart illustrates the percentage of households having different goods in a country in Europe in 2004 and 2008. Overall, most categories increased from 2004 to 2008, while figure for telephones decreased slightly. It is also important to note that the proportion of households with a TV was the highest, while the proportion of […]

The graph below gives information about the technology that households in one US city used for watching television between 2004 and 2014

The graph illustrates data about the technology to watch television at homes of a city of US in between the years 2004 and 2014. Overall,the use of internet rises over the period but consuption of broadcast fall gradually over the period. While the use of satellite fluctuate termendously but a minor decrease of cable is […]

The chart below gives information about the growth of urban population in certain parts of the world including the prediction the future. of

The chart demonstrates the information abouth the urban population group growth of the universe such as Whole World, Africa, Asia, Latin America by years of 1950,2000, and 2030 Among the resutls Latin America came as most people live in city and will live in urbanization most . in 1950 their percentage started as biggest already […]

The chart below shows the expenditure on three categories among different age groups of residents in the UK in 2004

The chart illustrates citizens’ expenditure on three certain categories in five different age groups in Britain in 2004. In conclusion, citizens’ spending on food and drink witnessed an upward trend as the age grew. By comparison, the expenditure on restaurant and hotel decreased overall. As the age groups get older, citizens’ budgets on entertainment climbed […]

Task 01: Bar Chart The chart below shows waste collection by a recycling centre from 2011 to 2015 Waste collected by a recycling centre (tons of waste)

The bar chart compared the waste collection by a recycling centre from 2011 to 2015. Overall, all types of waste fluctuated, with paper having the highest figure at the end of the period, while garden had the lowest. At the begining of the period, 57 tons of paper were collected by a recycling centre, which […]

See All
We have detected unusual activity on your device.
Please verify your identity to continue.
Note: This verification step won't sign you in. If you have a premium account, please log in to access the service as usual.
Google/Gmail Verification
Or verify using Email/Code
We've sent a verification code to:
youremail@gmail.com (Not your email?)
Enter it below to complete the verification process.
Ensure your email address is correct, your inbox is not full, and you check your spam folder. If no email arrives, consider using an alternative email.
You will need a Premium plan to perform your action!
Note: If you already have a premium account, please log in to access our services as usual.

Plans & Pricing

Our mission is to make quality education accessible for everyone.
However, to keep our hardworking team running and this service alive, we genuinely need your support!
By opting for a premium plan, not only do you sustain us in achieving the mission, but you also unlock advanced features to enrich your learning experience.

Free

For learners who aren't pressed for time

What's included on Free
100+ Cambridge IELTS Tests
Instant IELTS Writing Task 1 & 2 Evaluation (2 times/month)
Instant IELTS Speaking Part 1, 2, & 3 Evaluation (2 times/month)
Instant IELTS Writing Task 1 & 2 Essay Generator (2 times/month)
500+ Dictation & Shadowing Exercises
100+ Pronunciation Exercises
Flashcards
Other Advanced Tools

Premium

For those serious about advancing their English proficiency, and for IELTS candidates aspiring to boost their band score by 1-2 points (especially in writing & speaking) in just 30 days or less

What's included on Premium
Save Your IELTS Test Progress & Analyze Mistakes By Question Type
Save Your Own Flashcard Sets & Use Them On Any Device
Unlock All Courses, IELTS Tests, Section & Part Practice
Unlimited AI Conversations
Unlimited AI Writing Enhancement Exercises
Unlimited IELTS Writing Task 1 & 2 Evaluation
Unlimited IELTS Speaking Part 1, 2, & 3 Evaluation
Checked Answers Will Not Be Published
Unlimited IELTS Writing Task 1 & 2 Essay Generator
Unlimited IELTS Speaking Part 1, 2, & 3 Sample Generator
Unlimited Usage Of Advanced Tools & AI Features
Priority Support within 24h (12-month plan only)

Due to the nature of our service and the provided free trials, payments are non-refundable.