Our system will evaluate the answer based on this AI-generated description.
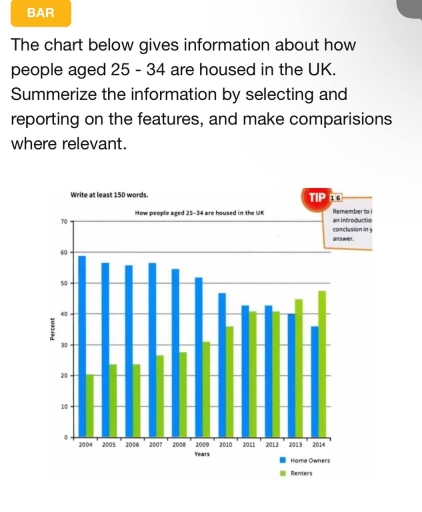
The image depicts a bar chart showing UK housing statistics for individuals aged 25-34 from 2004 to 2014, with "Home Owners" and "Renters" as categories; in 2004, home ownership stood at approximately 59% and renting at around 21%; in 2005, home ownership was close to 57% and renting at about 22%; in 2006, home ownership approximately 56% and renting at about 23%; in 2007, home ownership near 54% and renting about 24%; in 2008, home ownership at roughly 53% and renting around 26%; in 2009, home ownership approximately 50% and renting at 28%; in 2010, home ownership around 48% and renting at 31%; in 2011, home ownership approximately 45% and renting at 34%; in 2012, home ownership near 43% and renting about 36%; in 2013, home ownership close to 41% and renting around 38%; in 2014, home ownership stood at 36% and renting at 48%.
Given the complexity of the image, the above description may not be entirely accurate.
Skyrocket your IELTS band score by 1-2 points in under a month with our premium plan!
Note: Both the topic and the answer were created by one of our users.
The data below displays how residents within the group age of 25-34 are housed in the united kingdom.
Overall, the porportion of home owners declinded steadily throught the period meanwhile a noticeable growth was noticed in renters.Despite that the amount of home owners was higher than renters.
The Home owners levels ranged within 50%-60% in 2004 up to 2009, which then fell below 50% in 2010 and continued to decrease reaching approximately 35% in 2014.
The porportion of renter was at 20% in 2004 and resumed to increase throughtout the period and finally in 2013 was able to overtake the renters percenatge by it being at 45% and owners at 40% and later on in 2014 reaching just below 50%.The only years were renters exceeded home owners was from 2013 to 2014 with renters levels reaching above 40% and just below 50%.
Word Count: 142
