🔥 Today Only: Save 30% on Premium — Offer Ends Soon! - Upgrade Now!
Bar Chart

Band 5+: The chart below gives information about how people aged 25 - 34 are housed in the UK. Summerize the information by selecting and reporting on the features, and make comparisions where relevant.

Image for topic: The chart below gives information about how people aged 25 - 34 are housed in the UK. Summerize the information by selecting and reporting on the features, and make comparisions where relevant.
Our system will evaluate the answer based on this AI-generated description.
The image depicts a bar chart showing UK housing statistics for individuals aged 25-34 from 2004 to 2014, with "Home Owners" and "Renters" as categories; in 2004, home ownership stood at approximately 59% and renting at around 21%; in 2005, home ownership was close to 57% and renting at about 22%; in 2006, home ownership approximately 56% and renting at about 23%; in 2007, home ownership near 54% and renting about 24%; in 2008, home ownership at roughly 53% and renting around 26%; in 2009, home ownership approximately 50% and renting at 28%; in 2010, home ownership around 48% and renting at 31%; in 2011, home ownership approximately 45% and renting at 34%; in 2012, home ownership near 43% and renting about 36%; in 2013, home ownership close to 41% and renting around 38%; in 2014, home ownership stood at 36% and renting at 48%.
Given the complexity of the image, the above description may not be entirely accurate.
Note: Both the topic and the answer were created by one of our users.

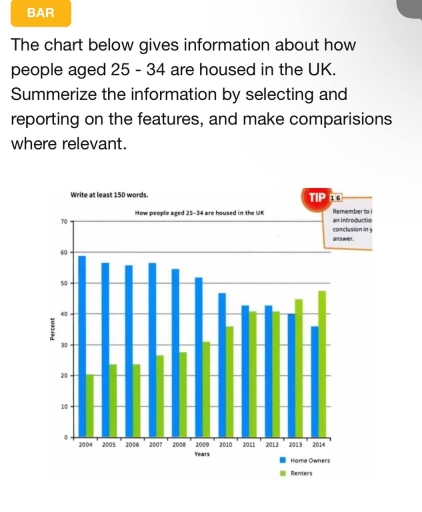
The bar chart illustrates the information about how people aged from 25 to 34 are housed whether they are renters or home owners in the United Kingdom for a period of 10 year from 2004 to 2014.

Overall, it can be seen that the home owners scored by far the most percent for almost all the period. Whereas, the percentage of renters increased significatly over the years to became the leader by 2014.

The amount of renters started with 20% by 2004, while, the house owners constitued 60%.

Moreover, the amount of renters continued to rise to equal approximately the pecentage of home owners by 2011 and 2012 with 40%, it reached its peak by 2014 with almost 50%.

Meanwhile, the house owners constitued the biggest share until 2013 when it reached 40% to leave the renters in the top, it kept increasing in the following year to finally reach approximately 35%.

Word Count: 152

Answers On The Same Topic:

The chart below gives information about how people aged 25 – 34 are housed in the UK. Summerize the information by selecting and reporting on the features, and make comparisions where relevant.

The bar chart shows the percentage of house ownership type from young adults aged 25 to 34 in the UK. Overall, the trend of people have their own home saw a gradual decrease with a not significant fluctuation and the percentage of renters change in the opposite way across the year. This show in more […]

The chart below gives information about how people aged 25 – 34 are housed in the UK. Summerize the information by selecting and reporting on the features, and make comparisions where relevant.

The data illustrate the number of residents of specific age between 25 to 34 owned houses in United Kingdom from 2004 to 2014. Overall, the proportion of house owner over the the span of 10 years declines with the increasing trend of renters throughtout this period. But still there is still large number of indiviuals […]

The chart below gives information about how people aged 25 – 34 are housed in the UK. Summerize the information by selecting and reporting on the features, and make comparisions where relevant.

The bar chart illustrates the proportion of UK residents aged 25 to 34 who were either homeowners or renters between 2004 and 2014. Overall, there was a significant decline in the percentage of young homeowners, while the proportion of renters rose steadily over the same period. The two trends moved in opposite directions, with renters […]

The chart below gives information about how people aged 25 – 34 are housed in the UK. Summerize the information by selecting and reporting on the features, and make comparisions where relevant.

The data below displays how residents within the group age of 25-34 are housed in the united kingdom. Overall, the porportion of home owners declinded steadily throught the period meanwhile a noticeable growth was noticed in renters.Despite that the amount of home owners was higher than renters. The Home owners levels ranged within 50%-60% in […]

See All

Other Topics:

The chart below shows the results of a European survey into young people's expectations for change in five different areas of life in the next 20 years. They were asked if they thought things would improve or get worse.

The bar chart presents the expectation for change in five categories including communication between people, quality of food, water, air in cities and health in the next 20 years by young people in a European, measuring in percentage. Overall, the percentage of young people’s expectations for change in communication is the only figure has the […]

The graph shows the number of proficient English speakers from different countries by the year of their arrival in England and Wales. Summarise the information by selecting and reporting the main features, and make comparisons where relevant. Write at least 150 words

The bar chart compares the information of proficient english language speakers arrving in England and Wales from Europe and middle east and Asian countries by the year of their arriving. Overall, number of english speaker varied considerably over the years, Europe had the hightest number of english speaker as compared with middle east and asia […]

The graphs below give information about computer ownership as a percentage of the population between 2002 and 2010, and by the level of education for the years 2002 and 2010.

The bar chart illustrate an information about camputer ownership and it shows the literacy level from 2002 to 2010. Overall, computer ownership had always increased over the 10 years, the level of the education is presented in five different categories, these are: No high school diploma, High school graduate, Undergraduaate degree, Master’s degree, and Other […]

The bar charts below show the number of hours each teacher spent teaching in different schools in four different countries.

The bar charts illustrate the number of hours each teacher spent teaching in primary, lower secondary, upper secondary in four different countries (Japan, Spain, Iceland and the USA) in the year 2001 Overall, the USA recored the greatest number of teaching hours, whereas Japan had the lowest. Notaly, each teacher spent the most teaching hours […]

The chart below illustrates the amount of waste collected by a recycling centre between 2011 and 2015. Provide an overview of the information by identifying and describing the key details, and include comparisons where appropriate.

The linegraph delineates the amount of waste collected by a recycling centre over the span of 4 years, starting from 2011 to 2015. Overall, it is immediately apparent that there were similar trends in the quantities of paper, glass, tins and garden over the given period. Another outstanding feature is that the figure for paper […]

The chart below shows the main reasons why students chose to study at a particular university in the UK in 1995 and 2005. Summarize the information by selecting and reporting the main features, and make comparisons where relevant.

The dynamic chart illustrates the proportion of students who decided 5 different reasons when choosing a UK university from 1995 to 2005 . Overall, the majority of reasons saw an incline in importance over the period, while two factors saw a declining trend. In addition, suitable degree courses remained the most significant consideration in both […]

See All
We have detected unusual activity on your device.
Please verify your identity to continue.
Note: This verification step won't sign you in. If you have a premium account, please log in to access the service as usual.
Google/Gmail Verification
Or verify using Email/Code
We've sent a verification code to:
youremail@gmail.com (Not your email?)
Enter it below to complete the verification process.
Ensure your email address is correct, your inbox is not full, and you check your spam folder. If no email arrives, consider using an alternative email.
You will need a Premium plan to perform your action!
Note: If you already have a premium account, please log in to access our services as usual.

Plans & Pricing

Our mission is to make quality education accessible for everyone.
However, to keep our hardworking team running and this service alive, we genuinely need your support!
By opting for a premium plan, not only do you sustain us in achieving the mission, but you also unlock advanced features to enrich your learning experience.

Free

For learners who aren't pressed for time

What's included on Free
100+ Cambridge IELTS Tests
Instant IELTS Writing Task 1 & 2 Evaluation (2 times/month)
Instant IELTS Speaking Part 1, 2, & 3 Evaluation (5 times/month)
Instant IELTS Writing Task 1 & 2 Essay Generator (2 times/month)
500+ Dictation & Shadowing Exercises
100+ Pronunciation Exercises
Flashcards
Other Advanced Tools

Premium

For those serious about advancing their English proficiency, and for IELTS candidates aspiring to boost their band score by 1-2 points (especially in writing & speaking) in just 30 days or less

What's included on Premium
Save Your IELTS Test Progress
Unlock All Courses & IELTS Tests
Unlimited AI Conversations
Unlimited AI Writing Enhancement Exercises
Unlimited IELTS Writing Task 1 & 2 Evaluation
Unlimited IELTS Speaking Part 1, 2, & 3 Evaluation
Checked Answers Will Not Be Published
Unlimited IELTS Writing Task 1 & 2 Essay Generator
Unlimited IELTS Speaking Part 1, 2, & 3 Sample Generator
Unlimited Usage Of Advanced Tools
Priority Support within 24h (12-month plan only)

Due to the nature of our service and the provided free trials, payments are non-refundable.
Nếu bạn là người Việt Nam và không có hoặc không muốn trả bằng credit/debit cards, bạn có thể thanh toán bằng phương thức chuyển khoản:


Chọn gói:
419,000₫ 277,000 ₫ cho gói 1 tháng (chỉ 9,233₫/ngày)
1,239,000₫ 597,000 ₫ cho gói 3 tháng (chỉ 6,633₫/ngày)
2,469,000₫ 1,027,000 ₫ cho gói 6 tháng (chỉ 5,706₫/ngày)
4,929,000₫ 1,417,000 ₫ cho gói 12 tháng (chỉ 3,936₫/ngày)


Sau khi chuyển khoản, vui lòng đợi trình duyệt tự động điều hướng bạn trở lại Engnovate và bạn sẽ ngay lập tức nhận được mã kích hoạt tài khoản premium.
Nếu có lỗi xảy ra, bạn có thể liên hệ với team thông qua một trong các phương thức: email đến helloengnovate@gmail.com hoặc nhắn tin qua facebook.com/engnovate.
Vì toàn bộ công cụ trên website đều có thể sử dụng thử miễn phí, Engnovate không hỗ trợ hoàn tiền.