Our system will evaluate the answer based on this AI-generated description.
The image depicts a bar graph showing the living issues of city residents in major UK cities in 2008. Newcastle residents report issues with health services (approximately 24%), education and training (approximately 19%), and air pollution (approximately 57%). Belfast residents report issues with health services (approximately 32%), education and training (approximately 30%), and air pollution (approximately 38%). Birmingham residents report issues with health services (approximately 30%), education and training (approximately 40%), and air pollution (approximately 30%). Cardiff has health services (approximately 34%), education and training (approximately 28%), and air pollution (approximately 38%). Manchester reports health services (approximately 45%), education and training (approximately 20%), and air pollution (approximately 35%). Glasgow residents report issues with health services (approximately 50%), education and training (approximately 20%), and air pollution (approximately 30%). London residents report issues with health services (approximately 55%), education and training (approximately 10%), and air pollution (approximately 35%).
Given the complexity of the image, the above description may not be entirely accurate.
Skyrocket your IELTS band score by 1-2 points in under a month with our premium plan!
Note: Both the topic and the answer were created by one of our users.
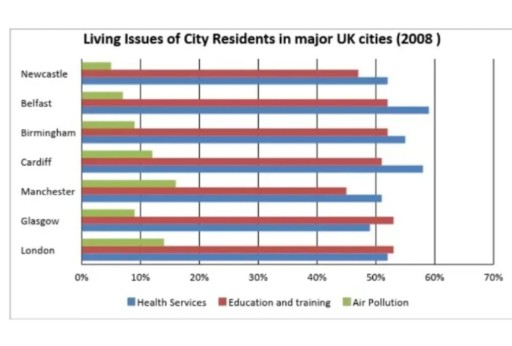
The bar chart illustrates the top three most reported issues, namely Health, Education and Air Pollution, among people living in seven different cities in the UK. This census is drawn up for the year 2008.
Belfast seems to be the city complaining most about the Health services with nearly 60% of the complaints, whereas Manchester can be seen reporting the most about the Pollution and air quality index (approximately 15%). In terms of Education and training, Glasgow and London reported a similar amount of complaints in this sector touching around 54%.
On the other hand, the least amount of problems in the Air pollution sector was recognized by Newcastle with less than 10% issues. Meanwhile, Manchester seemingly experienced the least amount of hurdles in the Education and Training aspect somewhere around 45%. Glasgow too reported the least amount of complaints in the Health services department with almost 50% complaints.
Overall, when talking about the issues reported in general, an uneven rate can be observed throughout the bar graph with the maximum reports filed by Belfast in general, contrary to the minimum filed by filed by Newcastle.
Word Count: 186