🔥 Today Only: Save 30% on Premium — Offer Ends Soon! - Upgrade Now!
Bar Chart

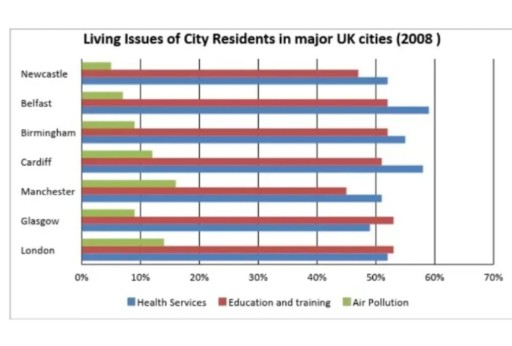
Band 7+: The chart below gives some of the most reported issues among people living in UK cities in 2008 (%). Summarise the information by selecting and reporting the main features, and make comparisons where relevant.

Image for topic: The chart below gives some of the most reported issues among people living in UK cities in 2008 (%). Summarise the information by selecting and reporting the main features, and make comparisons where relevant.
Our system will evaluate the answer based on this AI-generated description.
The image depicts a bar graph showing the living issues of city residents in major UK cities in 2008. Newcastle residents report issues with health services (approximately 24%), education and training (approximately 19%), and air pollution (approximately 57%). Belfast residents report issues with health services (approximately 32%), education and training (approximately 30%), and air pollution (approximately 38%). Birmingham residents report issues with health services (approximately 30%), education and training (approximately 40%), and air pollution (approximately 30%). Cardiff has health services (approximately 34%), education and training (approximately 28%), and air pollution (approximately 38%). Manchester reports health services (approximately 45%), education and training (approximately 20%), and air pollution (approximately 35%). Glasgow residents report issues with health services (approximately 50%), education and training (approximately 20%), and air pollution (approximately 30%). London residents report issues with health services (approximately 55%), education and training (approximately 10%), and air pollution (approximately 35%).
Given the complexity of the image, the above description may not be entirely accurate.
Note: Both the topic and the answer were created by one of our users.

The provided bar graph presents the distribution of the most frequently reported living issues among residents in several UK cities in the year 2008.

Overall, health services were the predominant concern across these cities, while air pollution was the least mentioned problem. The percentage of residents reporting air pollution ranged from approximately 5% to 15% across the cities.

Specifically, only three cities had more than 10% of their populations reporting air pollution as a major issue. Cardiff reported the highest percentage at around 12%, followed by the capital city at 13% and Manchester at 16%.

Furthermore, health services emerged as the most significant issue for residents in these cities, with education and training also garnering noteworthy attention. London and Glasgow had the highest proportions of residents reporting education and training as a concern, at 53% and 52% respectively. In contrast, Belfast had the highest percentage of residents reporting health services as an issue, at nearly 60%.

Word Count: 156

Answers On The Same Topic:

The chart below gives some of the most reported issues among people living in UK cities in 2008 (%). Summarise the information by selecting and reporting the main features, and make comparisons where relevant.

The bar chart depicts the concerns related to healthcare, education and training, and air quality across various UK cities in 2008. Overall, healthcare and educational services emerged as the primary concerns in all locations, whereas the majority of the population did not regard air pollution as a significant problem. To begin with, healthcare services posed […]

The chart below gives some of the most reported issues among people living in UK cities in 2008 (%). Summarise the information by selecting and reporting the main features, and make comparisons where relevant.

The chart illustrates several important living issues faced by inhabitants of seven major UK cities (Newcastle, Belfast, Birmingham, Cardiff, Manchester, Glasgow, and London) in 2008. Units are given in percentages. Overall, health services proved to be the most important living issue in most cities, with education and training a close second. Least worrisome of all […]

The chart below gives some of the most reported issues among people living in UK cities in 2008 (%). Summarise the information by selecting and reporting the main features, and make comparisons where relevant.

The bar graph presents data regarding the predominant concerns of residents in various UK cities during the year 2008, focusing on issues related to health services, education and training, and air pollution. In summary, health services emerged as the most significant issue reported across most cities, while education and training received considerable attention, and air […]

The chart below gives some of the most reported issues among people living in UK cities in 2008 (%). Summarise the information by selecting and reporting the main features, and make comparisons where relevant.

The bar chart illustrates three most reported living issues, namely health services, education and training, and air pollution, in 7 major cities in the UK in 2008. Overall, it is clear that health services is reportedly the biggest challenge in most cities, with a close second being education and training. Air pollution is reported considerably […]

The chart below gives some of the most reported issues among people living in UK cities in 2008 (%). Summarise the information by selecting and reporting the main features, and make comparisons where relevant.

The provided bar graph illustrates the most reported living issues among residents in major cities of the UK in 2008, covering health services, education and training, and air pollution. Overall, the data reveals variations in the percentages of reported living issues across different UK cities, with health services and education and training showing higher concerns […]

See All

Other Topics:

The bar chart below shows how exports from one country were transported in three different years. Summarise the information by selecting and reporting the main features, and make comparisons where relevant.

The bar chart represents exports from a certain country by the three mode of transport from 2010 to 2012. Overall, most exports were transported by sea during the three years, while the use of roads were less common in 2010 and 2011 among the other transport modes, and exports by air were less common in […]

The chart shows the percentage of car manufacturer's total sales in North America, South America, Europe and Asia.

The bar chart depicts the revenue distribution of different car manufacturers across various percentiles, focusing on regions such as North America, South America, Europe, and Asia. Overall, automobile sales in Asia grew, while the opposite trend was evident in North America, and the remaining categories fluctuated to varying extents. Additionally, despite having occupied the largest […]

Total number of british cruise passenger by age in year of 1975 and 2003.

The bar graph illustrates information about britain cruise passengers by age between 1975 and 2003. Overall, the percentage for passenger of different age-groups increased considerably throughout the period, although the figure for passenger over 64 experienced a shaper rise. Comapared with 1975, the figure was significantly higher in 2003. The passenger age of 24, which […]

The chart below shows the number of graduate students applying for jobs in different sectors after finishing an undergraduate degree at a UK university in 2015 and 2025 and the predicted figure for 2035

The bar chart presents the quantity of UK students applying for jobs in education, retail, finance, and I.T. sectors after graduation in the years 2015 and 2025 and estimate for 2035. On the whole, between 2015 and 2025, there was a downward trend in undergraduates applying for jobs Education and Retail, and an increase in […]

The bar chart shows expectations for change of European young people in the next 20 years in five different areas.

The provided chart shows expectations for changes among European adults in the next 20 years in five different areas. Overall, there are certain areas that will improve in the future. Health and water quality are moderate. However, air quality will need to improve. We also expect that food quality and people’s communication will improve in […]

The chart below shows the percentages ofdifferent types of householdwaste that were recycled in one city between 1992 and 2002. Summarise the information by selecting and reporting the main featuresand make comparisons where relevant. Write at least 150 words.

The bar chart illustrated proportions of household waste-glass,paper,cans,plastic recycled in a single city from 1992 to 2002. Looking from overall perspective,it’s clear that in glass is most recycled material each year and plastic is least recycled material,while cans are recovered by the end of the period. In 1992,glass the figure was approximately 15 percentage recycled […]

See All
We have detected unusual activity on your device.
Please verify your identity to continue.
Note: This verification step won't sign you in. If you have a premium account, please log in to access the service as usual.
Google/Gmail Verification
Or verify using Email/Code
We've sent a verification code to:
youremail@gmail.com (Not your email?)
Enter it below to complete the verification process.
Ensure your email address is correct, your inbox is not full, and you check your spam folder. If no email arrives, consider using an alternative email.
You will need a Premium plan to perform your action!
Note: If you already have a premium account, please log in to access our services as usual.

Plans & Pricing

Our mission is to make quality education accessible for everyone.
However, to keep our hardworking team running and this service alive, we genuinely need your support!
By opting for a premium plan, not only do you sustain us in achieving the mission, but you also unlock advanced features to enrich your learning experience.

Free

For learners who aren't pressed for time

What's included on Free
100+ Cambridge IELTS Tests
Instant IELTS Writing Task 1 & 2 Evaluation (2 times/month)
Instant IELTS Speaking Part 1, 2, & 3 Evaluation (2 times/month)
Instant IELTS Writing Task 1 & 2 Essay Generator (2 times/month)
500+ Dictation & Shadowing Exercises
100+ Pronunciation Exercises
Flashcards
Other Advanced Tools

Premium

For those serious about advancing their English proficiency, and for IELTS candidates aspiring to boost their band score by 1-2 points (especially in writing & speaking) in just 30 days or less

What's included on Premium
Save Your IELTS Test Progress & Analyze Mistakes By Question Type
Save Your Own Flashcard Sets & Use Them On Any Device
Unlock All Courses, IELTS Tests, Section & Part Practice
Unlimited AI Conversations
Unlimited AI Writing Enhancement Exercises
Unlimited IELTS Writing Task 1 & 2 Evaluation
Unlimited IELTS Speaking Part 1, 2, & 3 Evaluation
Checked Answers Will Not Be Published
Unlimited IELTS Writing Task 1 & 2 Essay Generator
Unlimited IELTS Speaking Part 1, 2, & 3 Sample Generator
Unlimited Usage Of Advanced Tools & AI Features
Priority Support within 24h (12-month plan only)

Due to the nature of our service and the provided free trials, payments are non-refundable.