Our system will evaluate the answer based on this AI-generated description.
The image depicts a bar graph showing the living issues of city residents in major UK cities in 2008. Newcastle residents report issues with health services (approximately 24%), education and training (approximately 19%), and air pollution (approximately 57%). Belfast residents report issues with health services (approximately 32%), education and training (approximately 30%), and air pollution (approximately 38%). Birmingham residents report issues with health services (approximately 30%), education and training (approximately 40%), and air pollution (approximately 30%). Cardiff has health services (approximately 34%), education and training (approximately 28%), and air pollution (approximately 38%). Manchester reports health services (approximately 45%), education and training (approximately 20%), and air pollution (approximately 35%). Glasgow residents report issues with health services (approximately 50%), education and training (approximately 20%), and air pollution (approximately 30%). London residents report issues with health services (approximately 55%), education and training (approximately 10%), and air pollution (approximately 35%).
Given the complexity of the image, the above description may not be entirely accurate.
Skyrocket your IELTS band score by 1-2 points in under a month with our premium plan!
Note: Both the topic and the answer were created by one of our users.
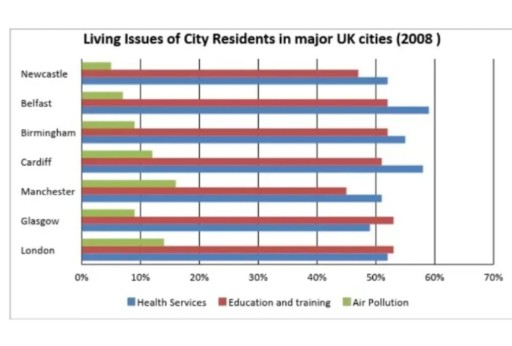
The chart represents some of the most reported living issues among city residents in the UK in 2008. Major cities like Newcastle, Belfast, Birmingham, Cardiff, Manchester, Glasgow, and London are represented vertically, and the living issues are represented horizontally in percentage. The living issues are represented with different colors, like health services in blue, education and training in red, and air pollution in green.
It is seen that Newcastle was the city with the lowest amount of air pollution, whereas Manchester had the highest. Education and training and health services were pretty high for all of the cities, with the maximum for health services being Belfast, almost reaching 60 percent, with Cardiff closely behind. It is also seen that the cities with the greatest issues with education and training were both Glasgow and London.
It is noticed that those cities with the highest population and more popularity are likely to have more air pollution but fewer issues with health and education services. All of the cities seem to have similar issues with health and education services, which need to be improved a lot.
Word Count: 183