Our system will evaluate the answer based on this AI-generated description.
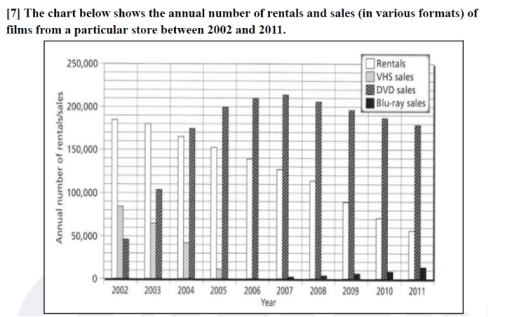
The image is a bar graph that displays the annual number of rentals and sales (in various formats) of films from a particular store between 2002 and 2011. The vertical axis represents the annual number of rentals/sales, ranging from 0 to 250,000. The horizontal axis represents the years, ranging from 2002 to 2011. Four types of film formats are shown: Rentals, VHS sales, DVD sales, and Blu-ray sales. Each year has four bars representing the number for each format. The bars for rentals are consistently the tallest across all years, with a slight decline from 2002 to 2011. VHS sales start from a considerable number in 2002, with a steep decline to almost negligible by 2011. DVD sales show an upward trend until 2005, remain relatively stable until 2009, and then display a slight decrease in 2010 and 2011. Blu-ray sales start from zero in 2002, show a small increase in 2006, and then a significant upward trend from 2007 onwards, reaching a peak in 2011. Specific numerical data points or percentages are not visible; however, the trends and relative comparisons between formats and over the years are clear.
Given the complexity of the image, the above description may not be entirely accurate.
Skyrocket your IELTS band score by 1-2 points in under a month with our premium plan!
Note: Both the topic and the answer were created by one of our users.
The bar chart compares the yearly number of film rentals and the sales of three formats (VHS, DVD and Blu-ray) in a particular shop from 2002 to 2011. Overall, the data highlights a clear shift from older formats to newer ones, alongside a steady reduction in rental demand.
At the beginning of the period, rentals were by far the most popular category, at about 185,000 transactions, which was significantly higher than both VHS and DVD sales, at around 50,000 and 49,000 respectively. While rentals then decreased consistently to just under 60,000 by 2011, VHS followed a similar downward trend but at a faster rate, falling to zero by 2006. In contrast, DVD sales rose dramatically during this time, overtaking rentals in the mid-2000s and reaching a peak of approximately 210,000 in 2007, making it the dominant format.
After 2007, DVD sales declined gradually, although they remained considerably higher than rentals by the end of the period. By comparison, Blu-ray sales, which were absent before 2007, started at under 10,000 and increased steadily to just above that level in 2011, remaining the least popular format throughout.
Word Count: 185
