🔥 Today Only: Save 30% on Premium — Offer Ends Soon! - Upgrade Now!
Bar Chart

Band 5+: The chart below shows the annual pay (thousands of US dollars) for doctors and other workers in seven countries in 2004. Summarise the information by selecting and reporting the main features, and make comparisons where relevant.

Image for topic: The chart below shows the annual pay (thousands of US dollars) for doctors and other workers in seven countries in 2004. Summarise the information by selecting and reporting the main features, and make comparisons where relevant.
Our system will evaluate the answer based on this AI-generated description.
The image contains a bar graph showing the annual pay for doctors and other workers in seven countries in 2004, measured in thousands of US dollars. The countries represented are France, Italy, Czech Republic, Germany, Finland, Switzerland, and the US. In France, other workers earn just above 20, while doctors earn around 60. In Italy, other workers earn just below 20, while doctors earn around 60. The Czech Republic has other workers earning around 10, and doctors earning just above 40. Germany shows other workers earning around 20, while doctors earn over 40. Finland has other workers earning around 20, and doctors earning over 60. Switzerland displays other workers earning over 40, and doctors earning over 120. The US has other workers earning around 40, and doctors earning over 100. Two shades of bars represent the data, with lighter bars indicating other workers and darker bars indicating doctors. The x-axis is labeled from 0 to 140. The title of the graph is "Annual pay for doctors and other workers in seven countries in 2004".
Given the complexity of the image, the above description may not be entirely accurate.
Note: Both the topic and the answer were created by one of our users.

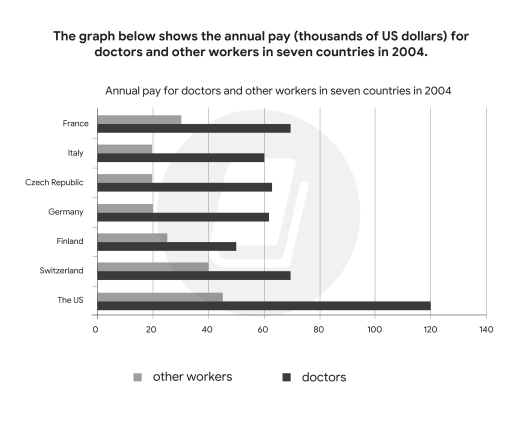
The figure illustrates the comparison of income between doctors and other workers in seven nations in 2004. This is remarkable that the US was the country paying the highest salary for health professionals. On the contrary, there was recorded a huge difference in the comparison of income in health and other occupations.

In 2004, by far the most significant income in thousand dollars was accounted for by the US, at 120 thousand dollars, almost third as high as the workers salary. Meanwhile, France and Switzerland was amounted to around 70 thousand dollars for doctors income. On the other hand, Italy, Czech Republic and Germany was recorded the same amount of doctors annual pay at around 60 thousand dollars. In contrast, doctors in Finland were paid the least at 50 thousands.

There was subjected to dissimilarities in the income of workers in other fields in seven countries in 2004. By 2004, employees in the US had been paid the most at 50 thousand dollars, followed by Switzerland at exactly 40 thousand. Whereas, France and Finland were recorded at 30 thousand and 25 thousand respectively. On the contrary, the least annual income of workers accounted for Italy, Czech Republic and Germany at under 20 thousand dollars.

Word Count: 204

Answers On The Same Topic:

The chart below shows the annual pay (thousands of US dollars) for doctors and other workers in seven countries in 2004. Summarise the information by selecting and reporting the main features, and make comparisons where relevant.

The graph shows the yearly pay for medical practitioners and other workers in the US and six European countries in 2004. Overall, in all countries pay for doctors more than other jobs, and the US pay highest salary for both doctors and other workers. Doctor’s lowest salary in Finland and other workers’ in Germany. The […]

The chart below shows the annual pay (thousands of US dollars) for doctors and other workers in seven countries in 2004. Summarise the information by selecting and reporting the main features, and make comparisons where relevant.

The bar chart illustrates how the occupational earnings for doctors and other workers varied across seven nations in 2004. Overall, physicians consistently commanded higher salaries than other professionals in all countries surveyed. The United States topped the list for both doctors and other workers in terms of annual income. Doctors’ annual salaries exhibited a wide […]

The chart below shows the annual pay (thousands of US dollars) for doctors and other workers in seven countries in 2004. Summarise the information by selecting and reporting the main features, and make comparisons where relevant.

The bar chart below gives information about the salary of doctors and other workers received per year from 7 distinct countries in the year of 2004. In general, The US holds the biggest pay for doctors, in contrast to Italy, Czech Republic, Germany all of which hit a low of payment for other workers. Noticeably, […]

The chart below shows the annual pay (thousands of US dollars) for doctors and other workers in seven countries in 2004. Summarise the information by selecting and reporting the main features, and make comparisons where relevant.

The chart given illustrates the annual salary earned by doctors and other careers in seven different nations in the year 2004. Overall, it is clear that the annual wage for doctors was much higher than for other occupations. Moreover, the biggest amount of money paid for doctors and other jobs was recorded in the US. […]

The chart below shows the annual pay (thousands of US dollars) for doctors and other workers in seven countries in 2004. Summarise the information by selecting and reporting the main features, and make comparisons where relevant.

he bar chart gives information about the yearly salaries of doctors compared to other professions across various countries in 2004. Overall, the US was the top payer for both doctors and other workers, while salaries in Italy, the Czech Republic, and Germany were relatively similar. Additionally, doctors received significantly higher annual pay than people doing […]

See All

Other Topics:

The chart below show depth of snow (cm) in particular ski resort in Canada in three individual years

The bar chart gives information about the changes in average snow depth at a Canadian ski resort over the six-month period in three years. Overall, it is clear that snow levels were significantly deeper in the second-half of the season, specifically February to April, compared to the earlier months. While year 2 showed a peak […]

The chart below shows the percentage of students choosing different university subjects in 2025

According to the chart it illustrates about precentage of students choosing different university subject in 2025. The y axis displayed percentage of students while the x axis represent university subject. In geanral: the business subject had the highest number at about 30 percentage. However the lowest is law subject at about 10 percentage. As we […]

The expenditures of both countries which is France's and UK or United Kingdom's consumer goods in 2010 are being shown in the chart.

The illustration provides an overview of the spending in the UK and France on products in a specific year. As an overall view, the biggest expenditure for both countries was cars, however the smallest spending for France was cameras, on the contrary for the UK which spent the least on Perfume. As it is presented, […]

The chart shows the percentage of households having different goods in a country in Europe in 2004 and 2008.

The bar chart below provides information about the proportion of households owning different items in a European nation in 2004 and 2008. Overall, there was a general increase in households possessing most goods, while the telephone was the only category witnessing a decline of ownership. TV was by far the most popular good in both […]

IELTS WRITING TASK 1 You should spend about 20 minutes on this task. The bar chart below shows the annual number of visitors to three different museums in London between 2013 and 2015. Summarize the information by selecting and reporting the main features, and make comparisons where relevant. Write at least 150 words.

The bar chart displays the yearly amount of visitors to three different museums in London from 2013 to 2015. Overall, The British Museum had the highest amount of visitors and increased guadually throughout the period, while the visitors of Natural History Museum remained stable . The Science Museum had the lowest number of visitors and […]

The charts below show the percentage of male and female students of different age groups who studied in Australia for full-time and part-time education in 2006.

The two bar charts provide information about the proportion of Australian learners in full-time and part-time education divided into age categories by gender in 2006. Overall, the results of both sexes in worktime were comparatively similar, with minor comparisons; however, females’ rating was relatively higher. Furthermore, a significant amount of students only were educated part-time, […]

See All
We have detected unusual activity on your device.
Please verify your identity to continue.
Note: This verification step won't sign you in. If you have a premium account, please log in to access the service as usual.
Google/Gmail Verification
Or verify using Email/Code
We've sent a verification code to:
youremail@gmail.com (Not your email?)
Enter it below to complete the verification process.
Ensure your email address is correct, your inbox is not full, and you check your spam folder. If no email arrives, consider using an alternative email.
You will need a Premium plan to perform your action!
Note: If you already have a premium account, please log in to access our services as usual.

Plans & Pricing

Our mission is to make quality education accessible for everyone.
However, to keep our hardworking team running and this service alive, we genuinely need your support!
By opting for a premium plan, not only do you sustain us in achieving the mission, but you also unlock advanced features to enrich your learning experience.

Free

For learners who aren't pressed for time

What's included on Free
100+ Cambridge IELTS Tests
Instant IELTS Writing Task 1 & 2 Evaluation (2 times/month)
Instant IELTS Speaking Part 1, 2, & 3 Evaluation (5 times/month)
Instant IELTS Writing Task 1 & 2 Essay Generator (2 times/month)
500+ Dictation & Shadowing Exercises
100+ Pronunciation Exercises
Flashcards
Other Advanced Tools

Premium

For those serious about advancing their English proficiency, and for IELTS candidates aspiring to boost their band score by 1-2 points (especially in writing & speaking) in just 30 days or less

What's included on Premium
Save Your IELTS Test Progress
Unlock All Courses & IELTS Tests
Unlimited AI Conversations
Unlimited AI Writing Enhancement Exercises
Unlimited IELTS Writing Task 1 & 2 Evaluation
Unlimited IELTS Speaking Part 1, 2, & 3 Evaluation
Checked Answers Will Not Be Published
Unlimited IELTS Writing Task 1 & 2 Essay Generator
Unlimited IELTS Speaking Part 1, 2, & 3 Sample Generator
Unlimited Usage Of Advanced Tools
Priority Support within 24h (12-month plan only)

Due to the nature of our service and the provided free trials, payments are non-refundable.
Nếu bạn là người Việt Nam và không có hoặc không muốn trả bằng credit/debit cards, bạn có thể thanh toán bằng phương thức chuyển khoản:


Chọn gói:
419,000₫ 277,000 ₫ cho gói 1 tháng (chỉ 9,233₫/ngày)
1,239,000₫ 597,000 ₫ cho gói 3 tháng (chỉ 6,633₫/ngày)
2,469,000₫ 1,027,000 ₫ cho gói 6 tháng (chỉ 5,706₫/ngày)
4,929,000₫ 1,417,000 ₫ cho gói 12 tháng (chỉ 3,936₫/ngày)


Sau khi chuyển khoản, vui lòng đợi trình duyệt tự động điều hướng bạn trở lại Engnovate và bạn sẽ ngay lập tức nhận được mã kích hoạt tài khoản premium.
Nếu có lỗi xảy ra, bạn có thể liên hệ với team thông qua một trong các phương thức: email đến helloengnovate@gmail.com hoặc nhắn tin qua facebook.com/engnovate.
Vì toàn bộ công cụ trên website đều có thể sử dụng thử miễn phí, Engnovate không hỗ trợ hoàn tiền.