Our system will evaluate the answer based on this AI-generated description.
The image presents a line graph detailing monthly average rainfall (mm) for Marrakesh, Dublin, Nur-Sultan, Sydney, and Tokyo in 2020; in January, Marrakesh records ~145mm, Dublin ~80mm, Nur-Sultan ~25mm, Sydney ~120mm, Tokyo ~50mm; in February, Marrakesh ~130mm, Dublin ~80mm, Nur-Sultan ~20mm, Sydney ~110mm, Tokyo ~55mm; in March, Marrakesh ~127mm, Dublin ~75mm, Nur-Sultan ~30mm, Sydney ~125mm, Tokyo ~70mm; in April, Marrakesh ~120mm, Dublin ~65mm, Nur-Sultan ~40mm, Sydney ~120mm, Tokyo ~85mm; in May, Marrakesh ~120mm, Dublin ~60mm, Nur-Sultan ~50mm, Sydney ~105mm, Tokyo ~100mm; in June, Marrakesh ~110mm, Dublin ~55mm, Nur-Sultan ~60mm, Sydney ~95mm, Tokyo ~120mm; in July, Marrakesh ~130mm, Dublin ~50mm, Nur-Sultan ~65mm, Sydney ~75mm, Tokyo ~130mm; in August, Marrakesh ~165mm, Dublin ~60mm, Nur-Sultan ~70mm, Sydney ~85mm, Tokyo ~145mm; in September, Marrakesh ~170mm, Dublin ~60mm, Nur-Sultan ~55mm, Sydney ~90mm, Tokyo ~140mm; in October, Marrakesh ~178mm, Dublin ~80mm, Nur-Sultan ~45mm, Sydney ~110mm, Tokyo ~130mm; in November, Marrakesh ~185mm, Dublin ~90mm, Nur-Sultan ~40mm, Sydney ~120mm, Tokyo ~115mm; in December, Marrakesh ~180mm, Dublin ~90mm, Nur-Sultan ~30mm, Sydney ~125mm, Tokyo ~80mm.
Given the complexity of the image, the above description may not be entirely accurate.
Skyrocket your IELTS band score by 1-2 points in under a month with our premium plan!
Note: Both the topic and the answer were created by one of our users.
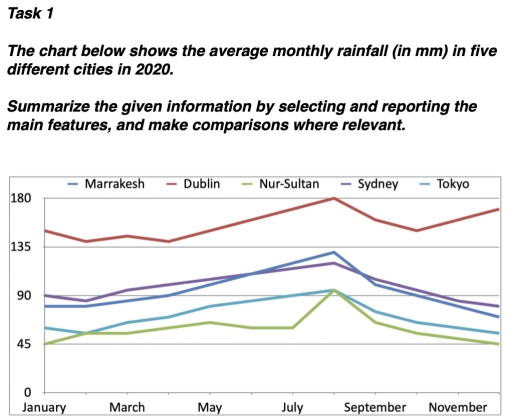
The line chart illustrates the average monthly rainfall, measured in millimetres, in five cities Marrakesh, Dublin, Nur-Sultan, Sydney, and Tokyo over the year 2020.
Overall, Dublin experienced the highest rainfall throughout the year, while Nur-Sultan recorded the lowest figures overall. Most cities showed a similar pattern, with rainfall increasing towards the middle of the year before declining in the later months.
Dublin’s rainfall remained consistently high, starting at around 150 mm in January, dipping slightly in spring, and then peaking at approximately 180 mm in July. Although it fell to about 145 mm in September, it rose again to nearly 170 mm by November. In contrast, Nur Sultan had much lower rainfall, beginning at roughly 45 mm in January and gradually increasing to a peak of about 90 mm in July, before steadily decreasing to around 45 mm at the end of the year.
Marrakesh and Sydney followed similar trends. Marrakesh rose from approximately 85 mm in January to a high of around 130 mm in July, then declined sharply to about 75 mm in November. Sydney showed a more moderate increase, peaking at roughly 115 mm in July before falling to around 80 mm. Tokyo experienced steady growth from about 60 mm in January to nearly 95 mm in July, followed by a gradual decrease towards the year’s end.
Word Count: 220
